文章信息:Yuyu Zhou, Xuecao Li, Wei Chen, Lin Meng, Qiusheng Wu, Peng Gong, & Karen C. Seto. (2022). Satellite mapping of urban built-up heights reveals extreme infrastructure gaps and inequalities in the Global South. Proceedings of the National Academy of Sciences: 119(46), e2214813119. https://doi.org/10.1073/pnas.2214813119
整理人:杨文,2023级硕士生
整理时间:2024年8月25日
Abstract: Information on urban built-up infrastructure is essential to understand the role of cities in shaping environmental, economic, and social outcomes. The lack of data on built-up heights over large areas has limited our ability to characterize urban infrastructure and its spatial variations across the world. Here, we developed a global atlas of urban built-up heights circa 2015 at 500-m resolution from the Sentinel-1 Ground Range Detected satellite data. Results show extreme gaps in per capita urban built-up infrastructure in the Global South compared with the global average, and even larger gaps compared with the average levels in the Global North. Per capita urban built-up infrastructures in some countries in the Global North are more than 30 times higher than those in the Global South. The results also show that the built-up infrastructure in 45 countries in the Global North combined, with ∼16% of the global population, is roughly equivalent to that of 114 countries in the Global South, with ∼74% of the global population. The inequality in urban built-up infrastructure, as measured by an inequality index, is large in most countries, but the largest in the Global South compared with the Global North. Our analysis reveals the scale of infrastructure demand in the Global South that is required in order to meet sustainable development goals.
摘要:关于城市建成基础设施的信息对于理解城市在塑造环境、经济和社会成果方面的作用至关重要。缺乏大面积建筑高度的数据限制了我们描述世界各地城市基础设施及其空间变化的能力。在这里,我们根据Sentinel-1地面探测卫星数据,以500米的分辨率绘制了2015年左右的全球城市建筑高度图集。结果显示,与全球平均水平相比,全球南方的人均城市建成基础设施差距巨大,与全球北方的平均水平相比差距更大。全球北方一些国家的人均城市建成基础设施比全球南方高出30多倍。研究结果还显示,全球北方45个国家的建成基础设施加起来占全球人口的16%,大致相当于全球南方114个国家的74%。以不平等指数衡量,城市建成基础设施的不平等在大多数国家都很严重,但与全球北方相比,全球南方的不平等程度最高。我们的分析揭示了全球南方为实现可持续发展目标所需的基础设施需求规模。
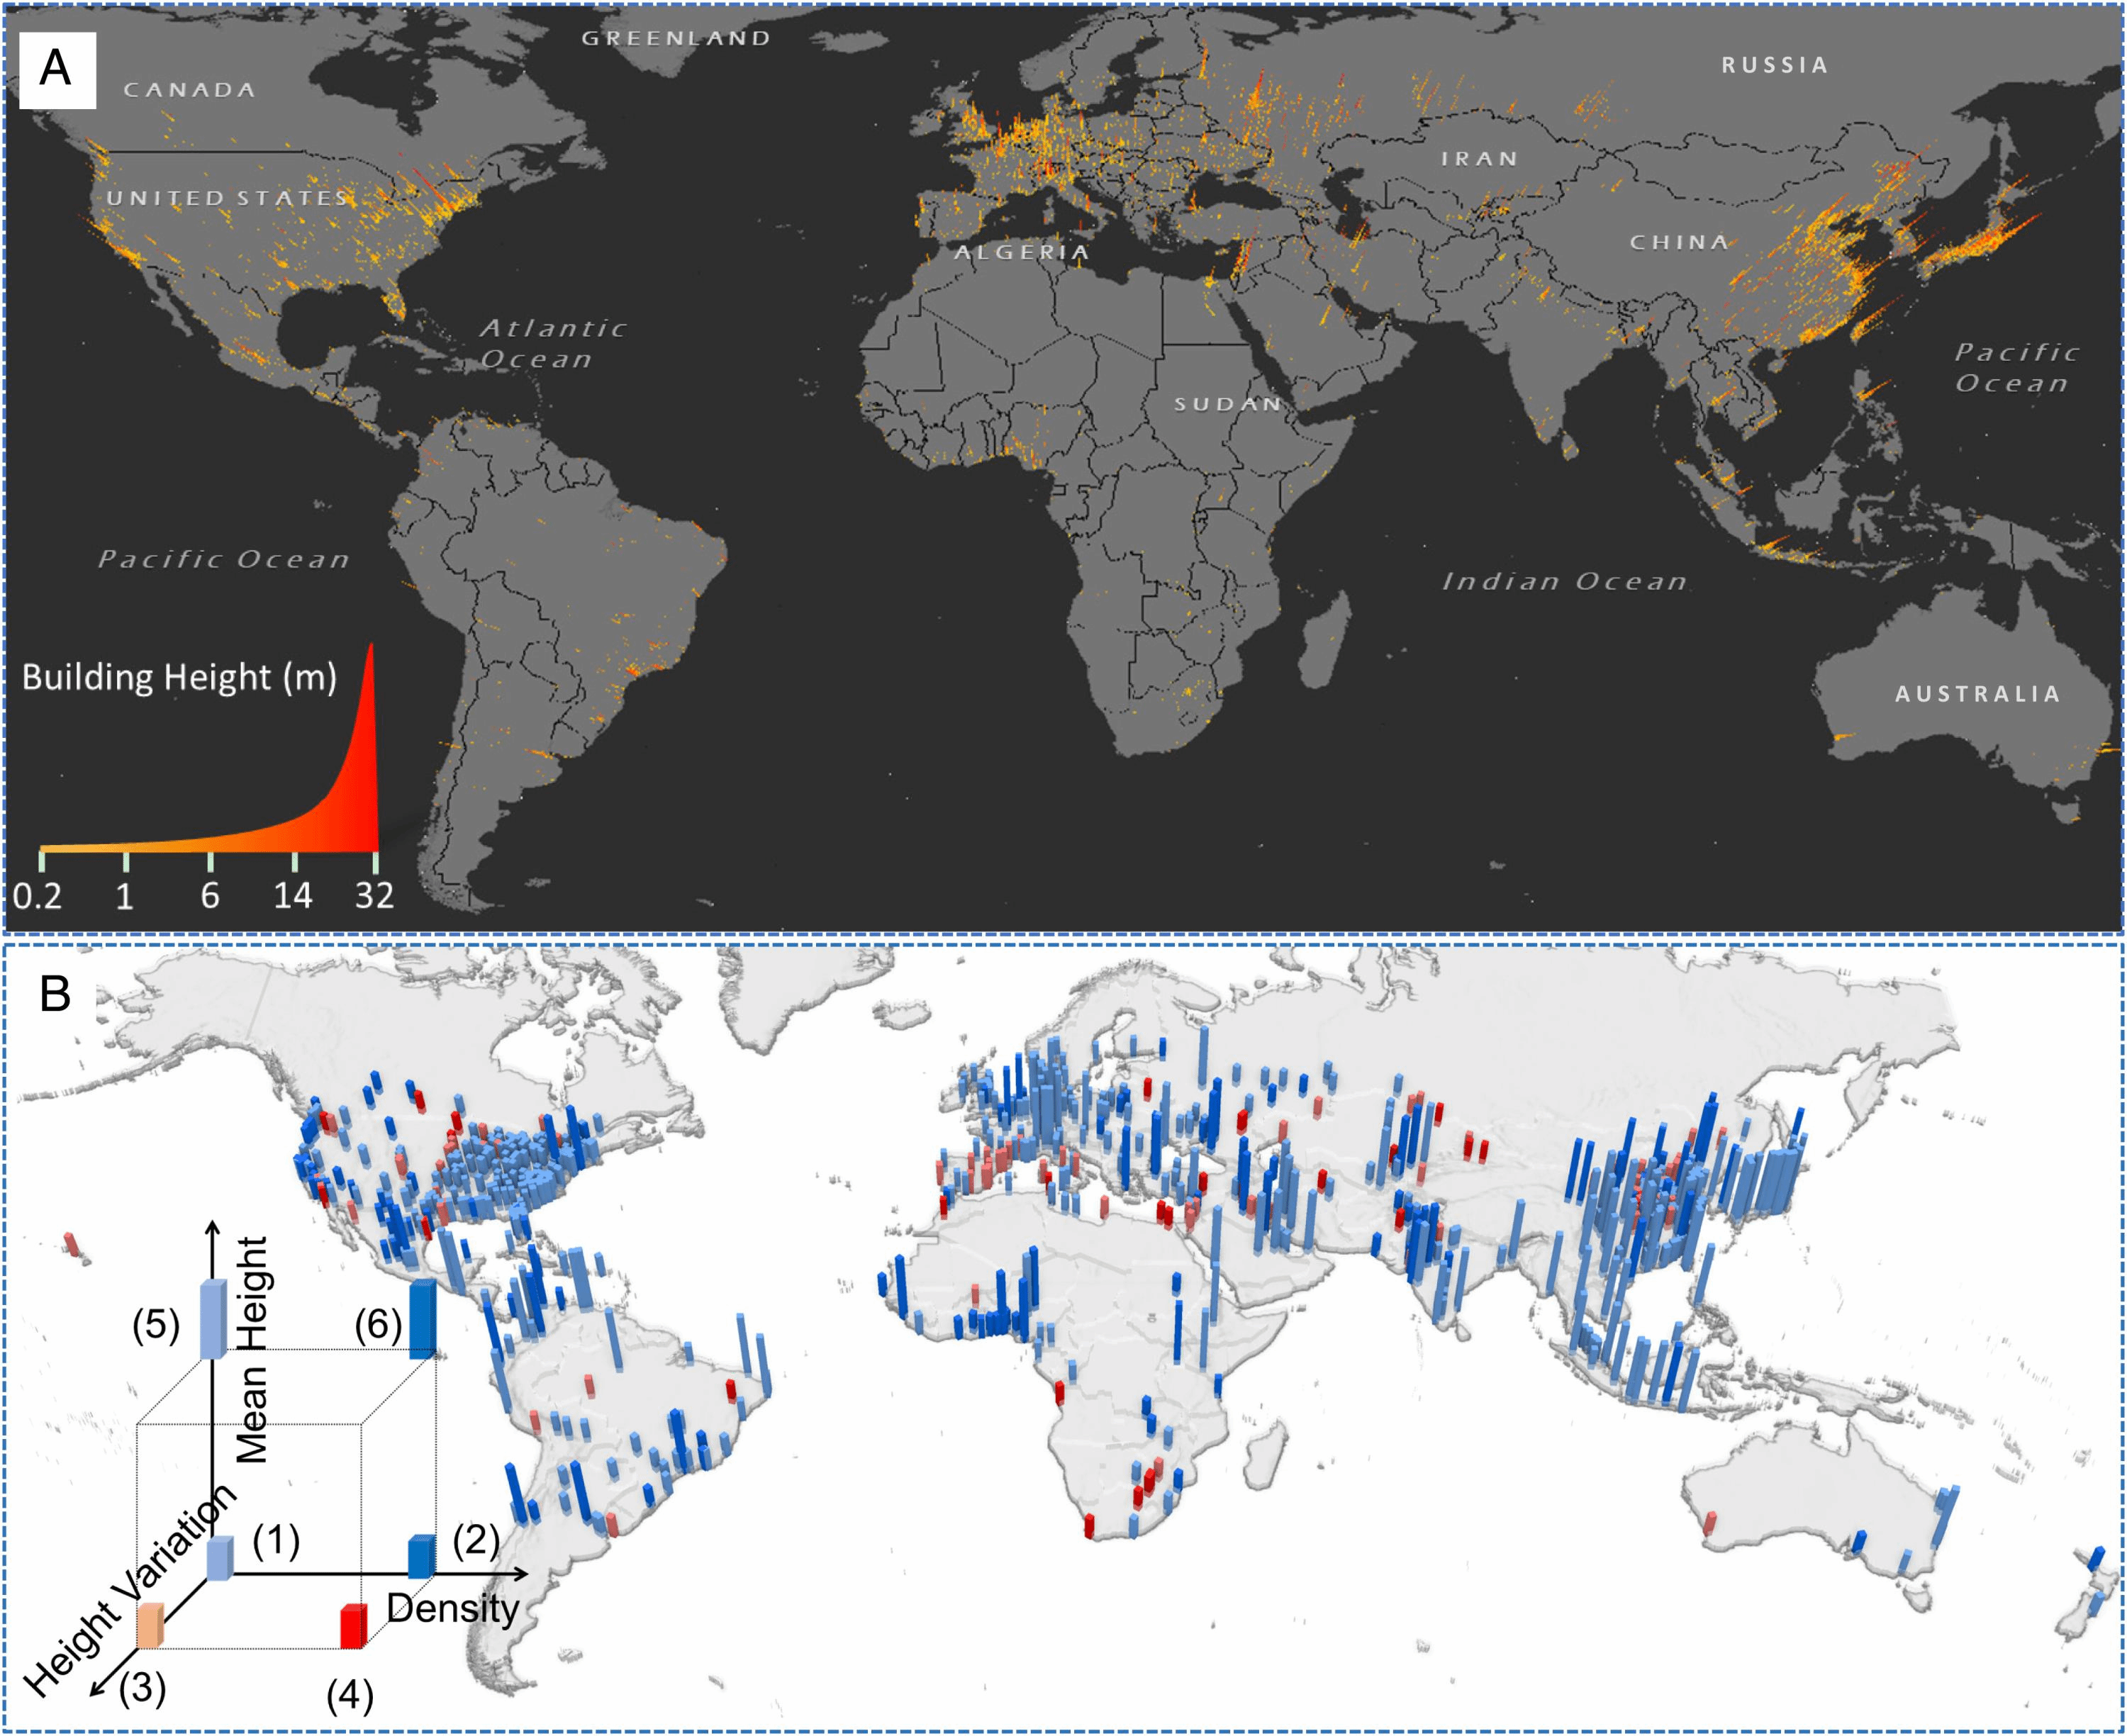
图(A)卫星观测得出的全球城市建成区高度。条形的颜色和高度代表每个 500 米网格中的建成高度。 (B) 面积大于 100 平方公里的城市的城市形态根据密度(不透水性)和建筑高度(平均值和变化)分为六种类型。这六种类型的城市是(1)稀疏且均匀低,(2)密集且均匀低,(3)稀疏且均匀低,(4)密集且均匀低,(5)稀疏且均匀高,以及(6)致密且均匀高
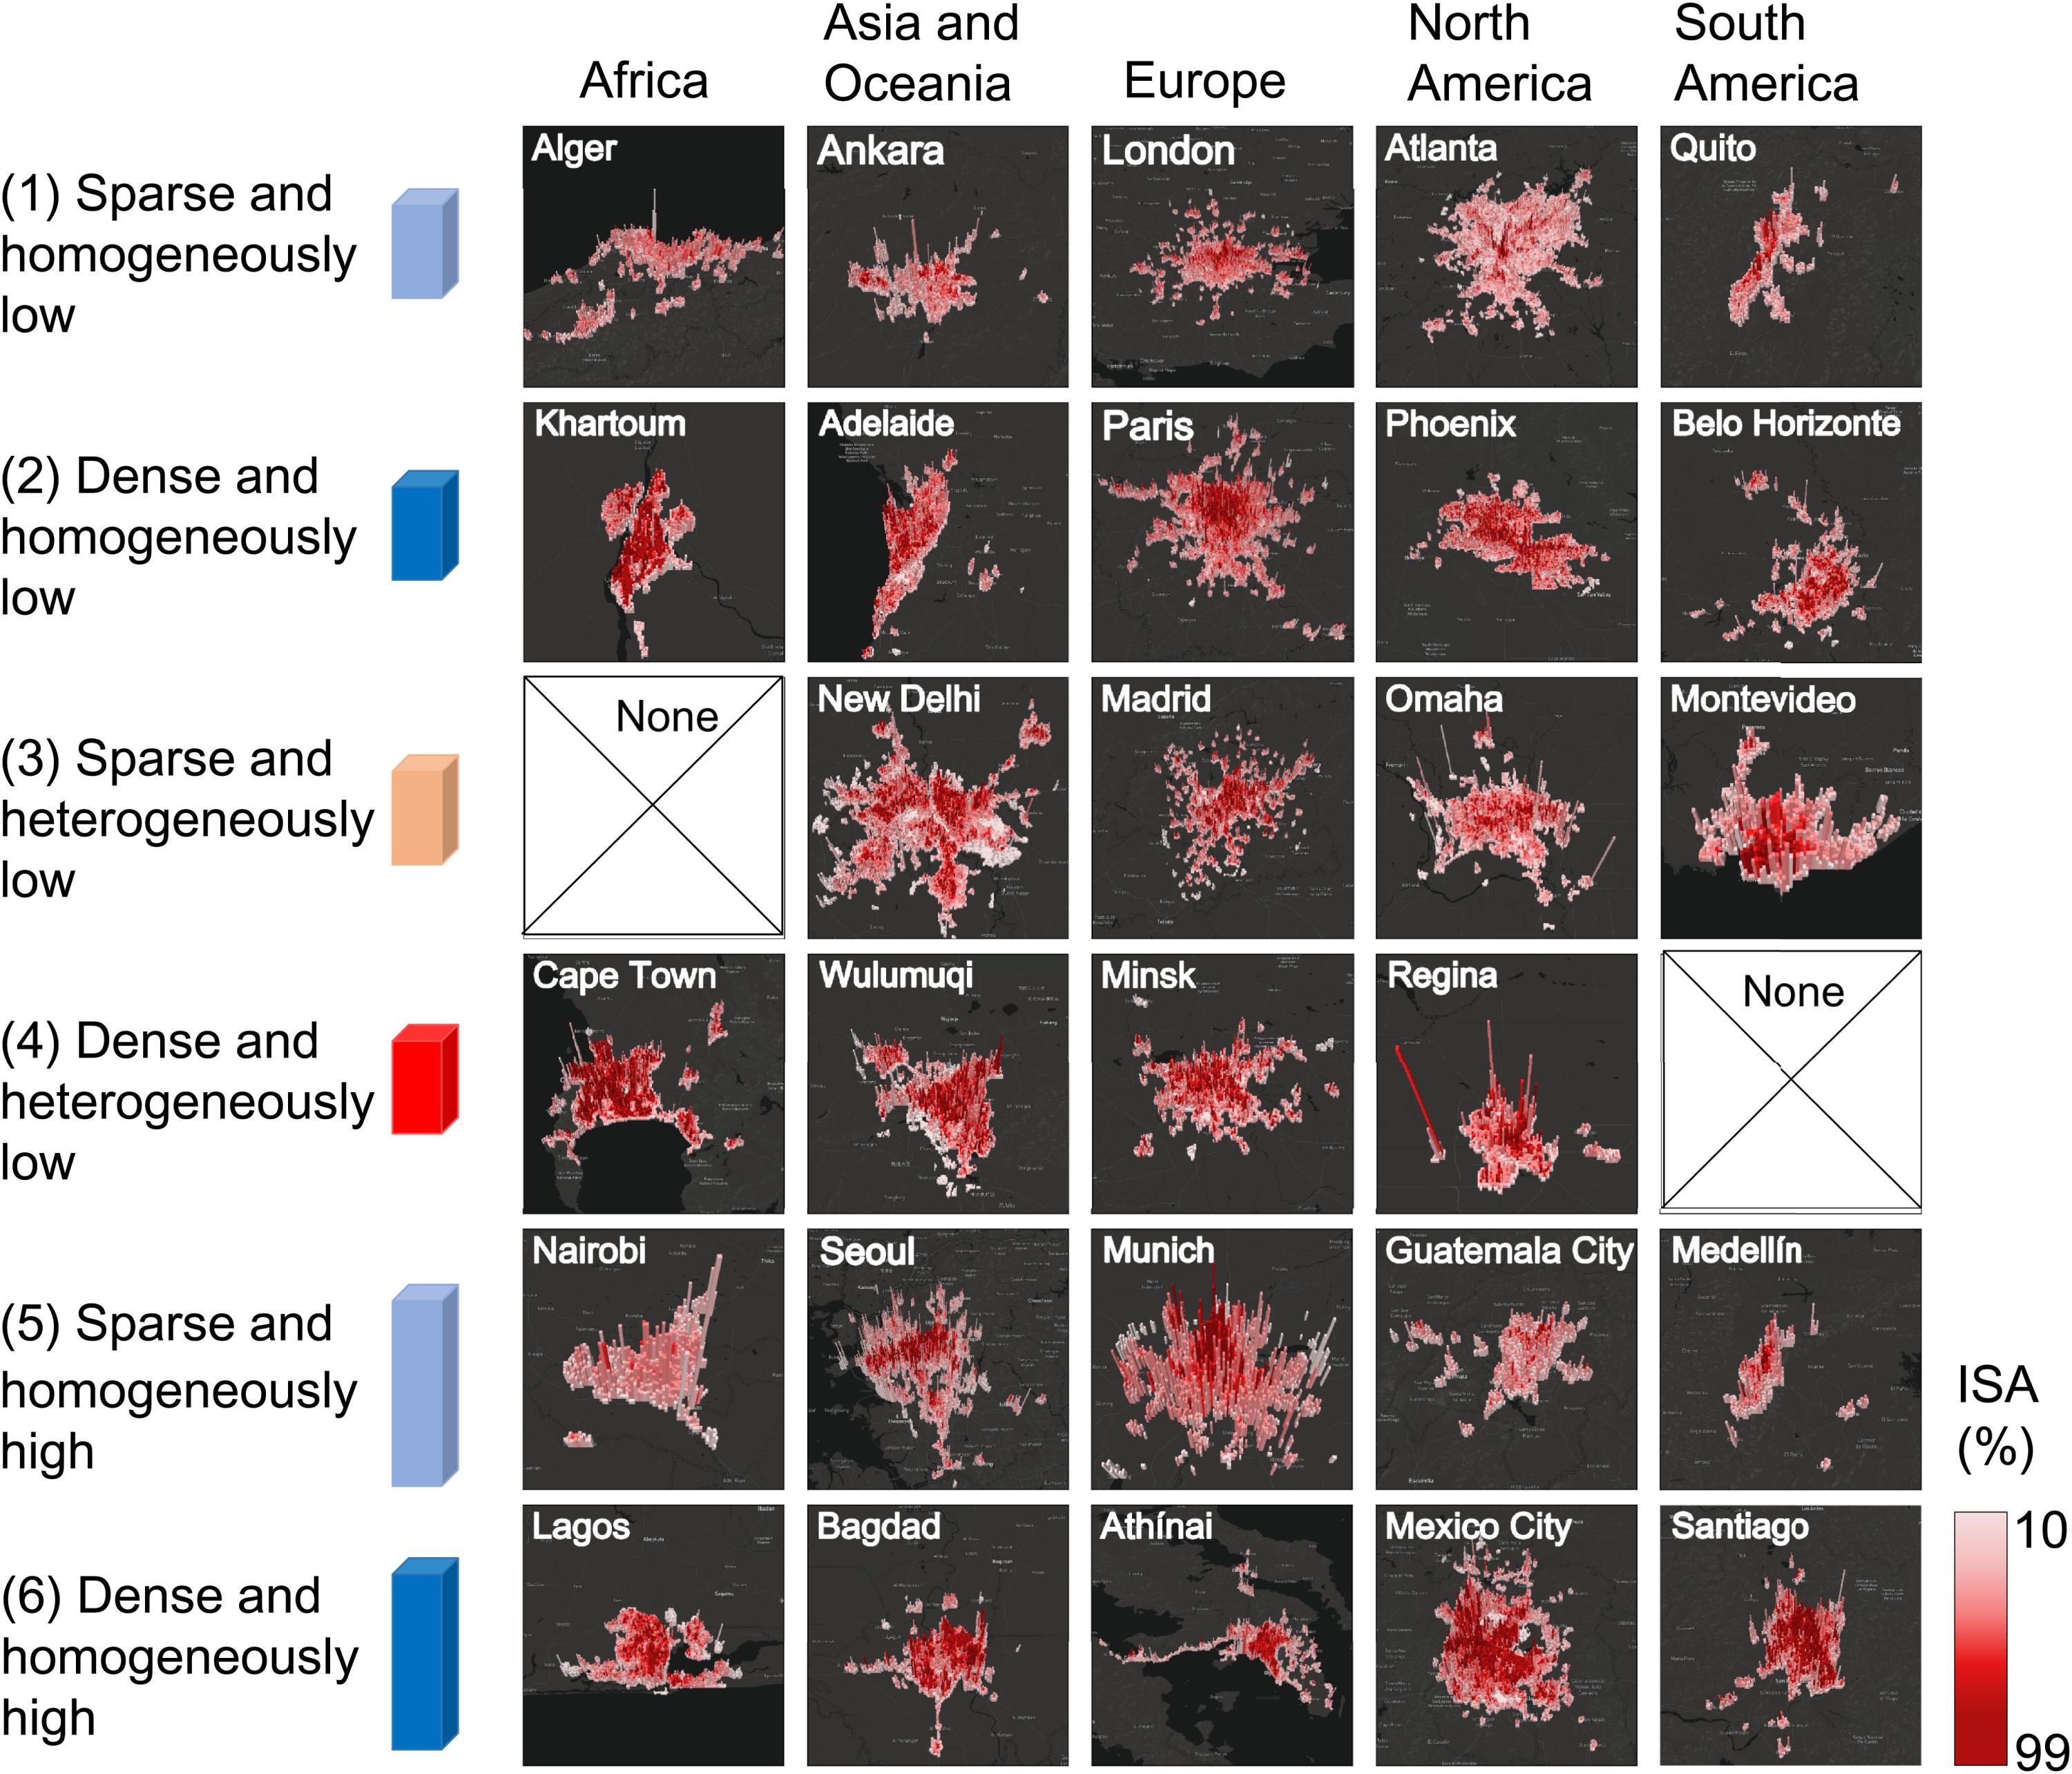
图 图 1B 中六种城市形态的代表性城市的 3D 视图。 None 表明该大陆不存在这样的城市群。不透水表面面积
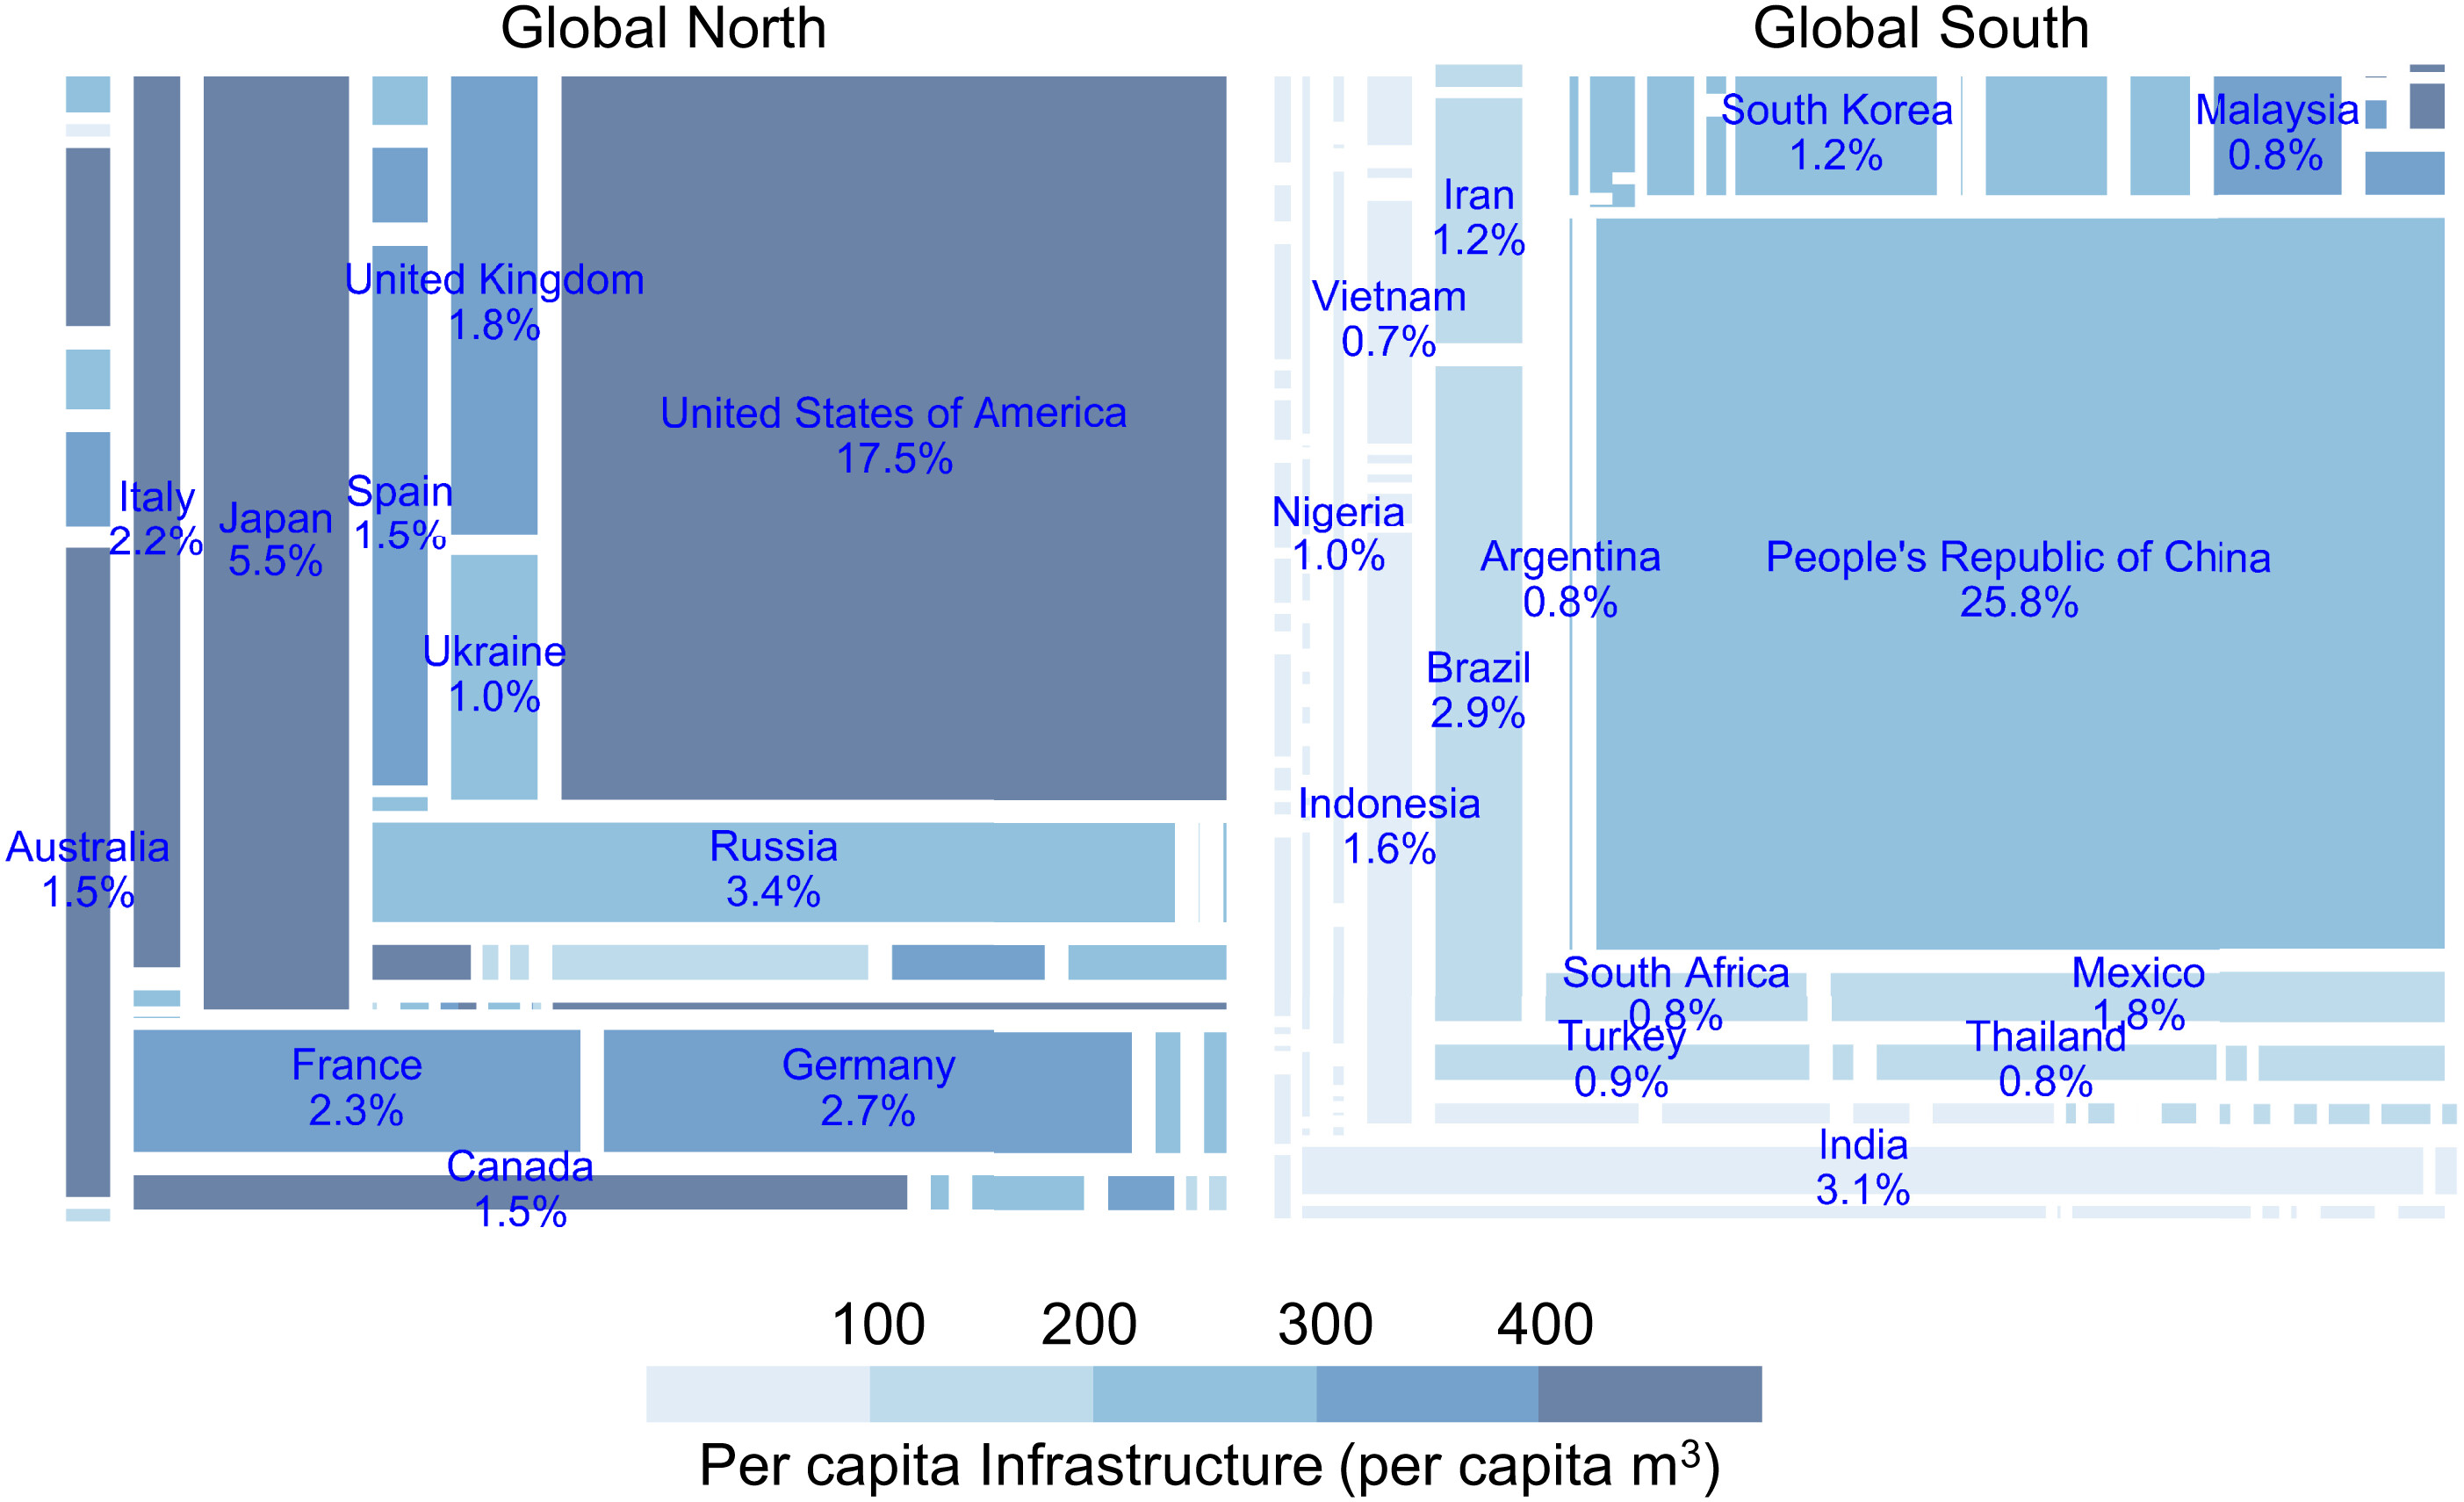
图 全球北方和南方城市建成基础设施的份额。北半球 45 个国家和南半球 114 个国家的基础设施建设占全球的比例大致相当。国家名称及其部分如图所示
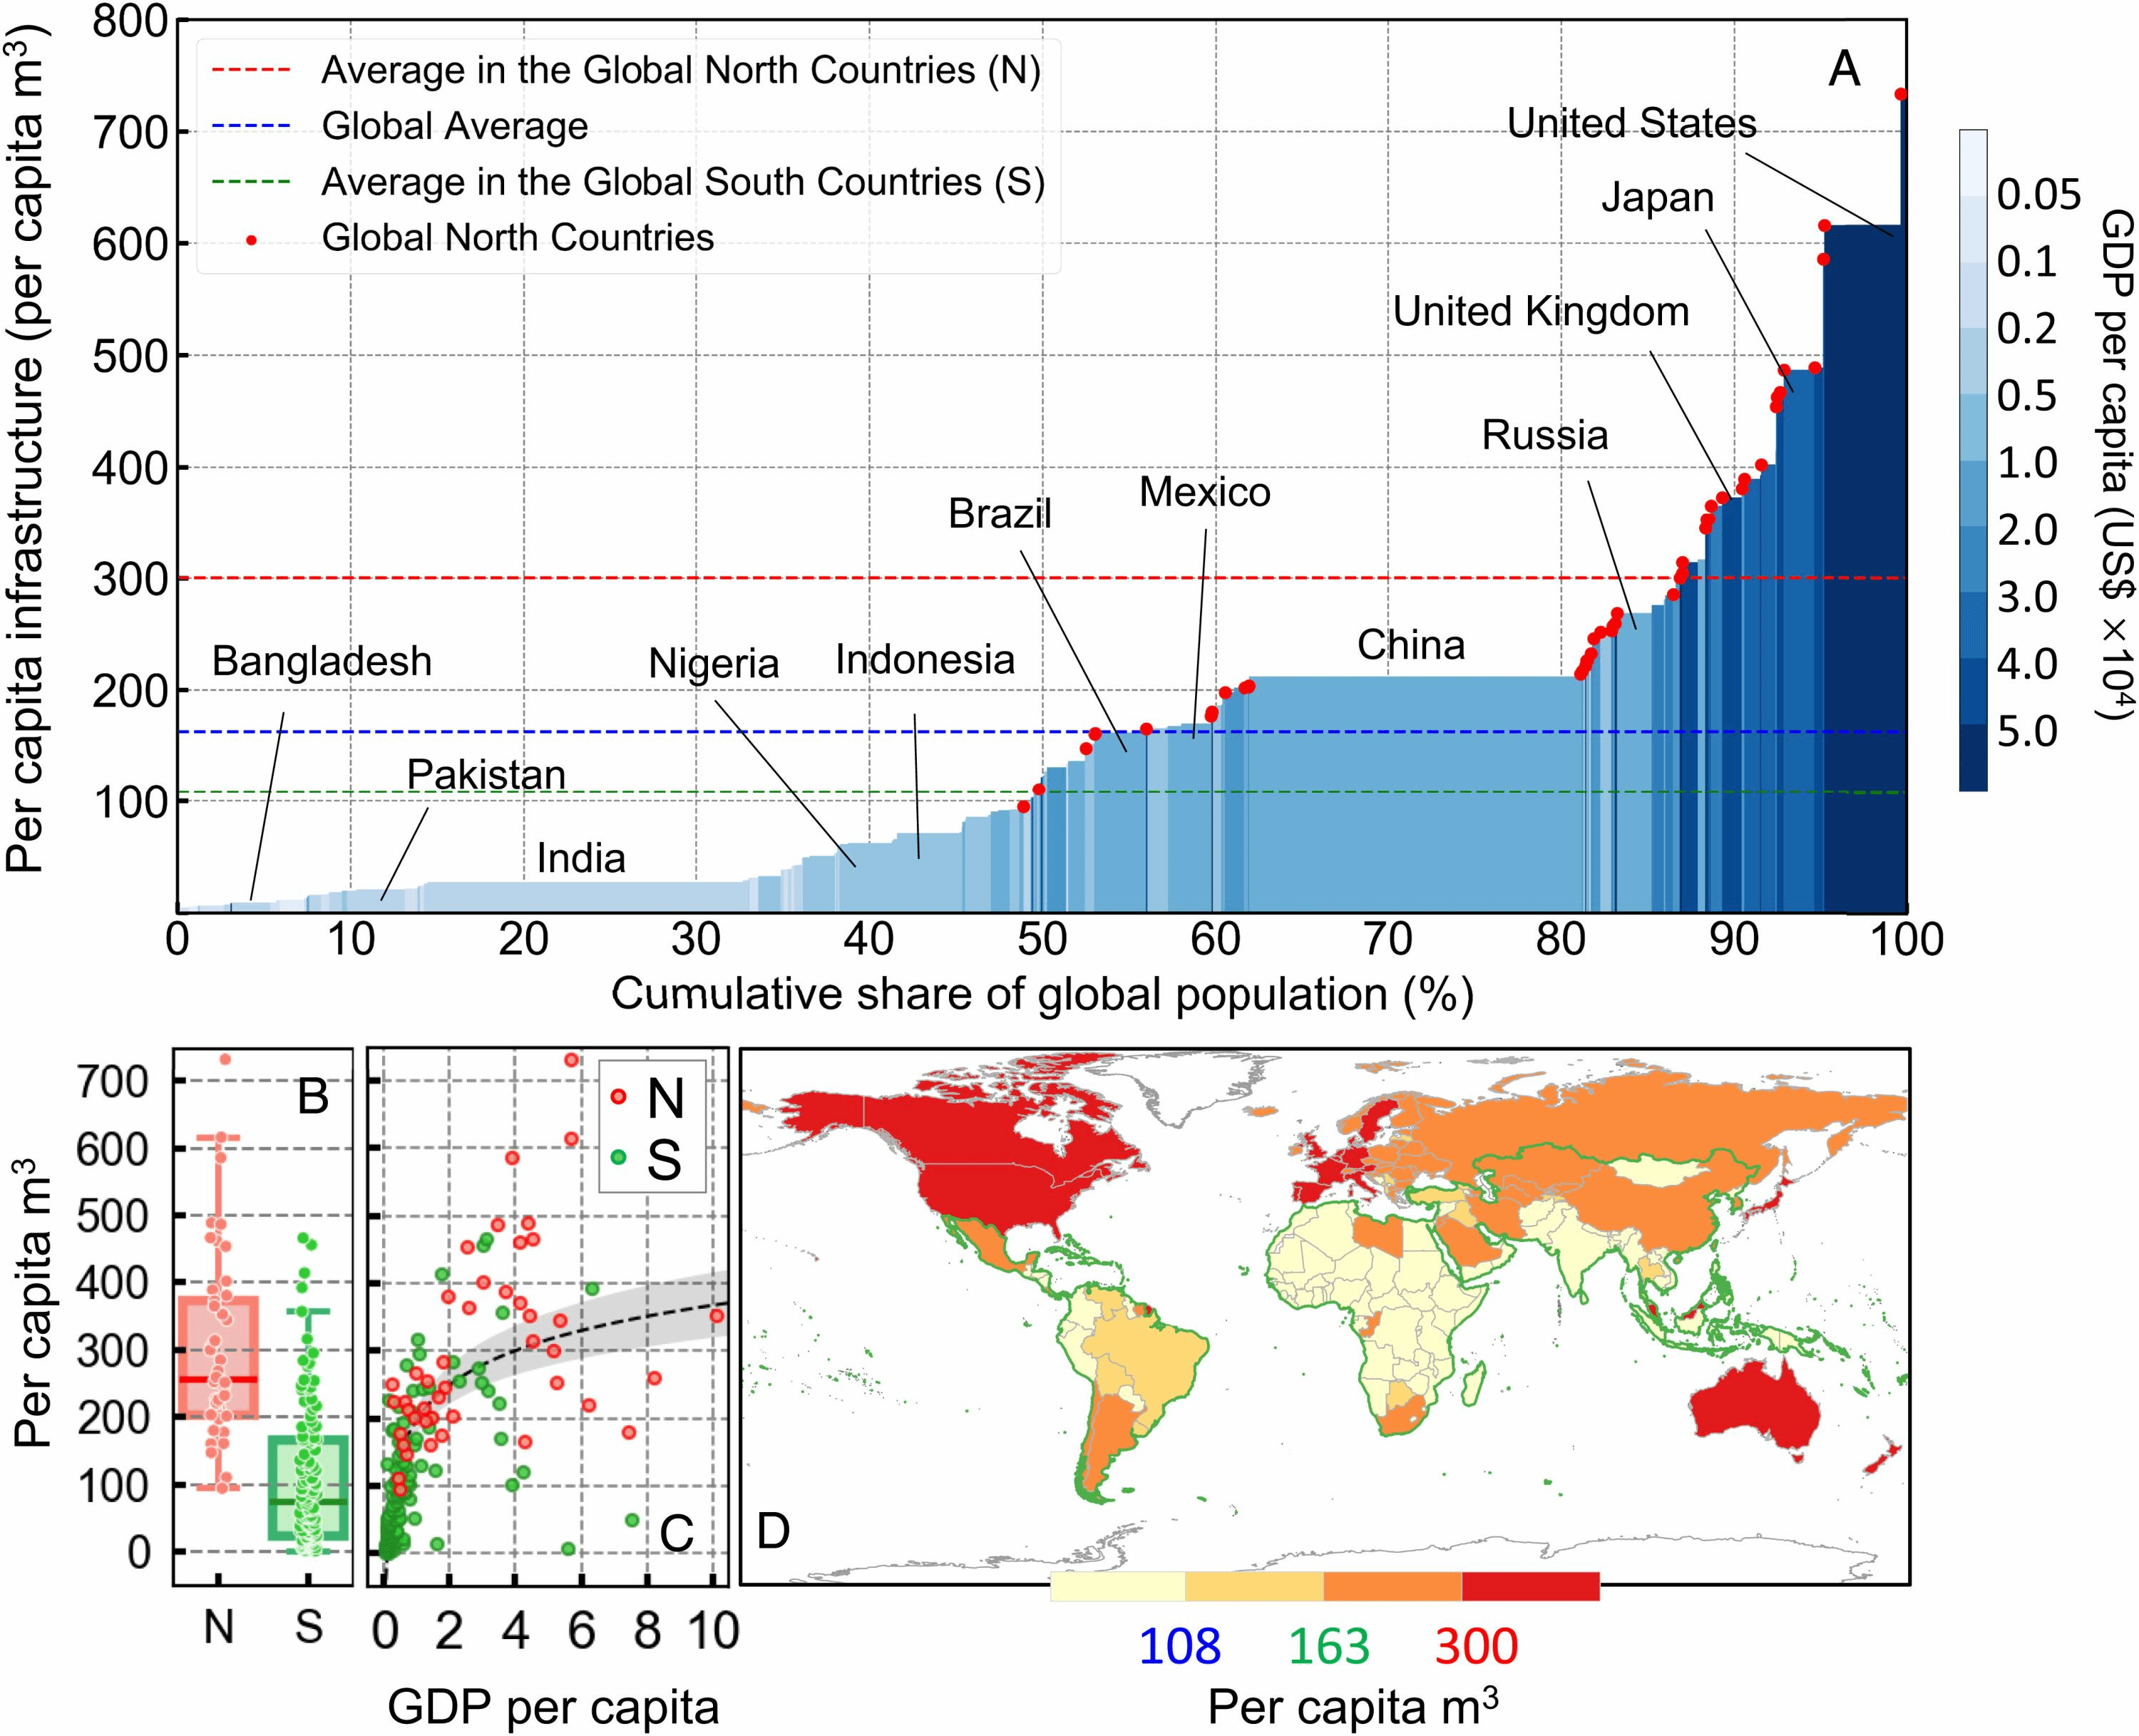
图 (A) 按国家划分的人均城市建成基础设施。红色、绿色和蓝色虚线分别是北半球国家(北半球;人均 300 立方米)、南半球国家(南半球;人均 108 立方米)和所有国家(人均 163 立方米)的平均值。条形宽度代表每个国家/地区的人口比例。颜色代表每个国家的人均GDP。红点表示北半球国家。 (B) 全球南方和北方的人均基础设施建成量。 (C) 全球南方和北方人均 GDP 与基础设施建设之间的关系。 (D) 人均基础设施建成图。地图中的绿色边界表示南半球国家。
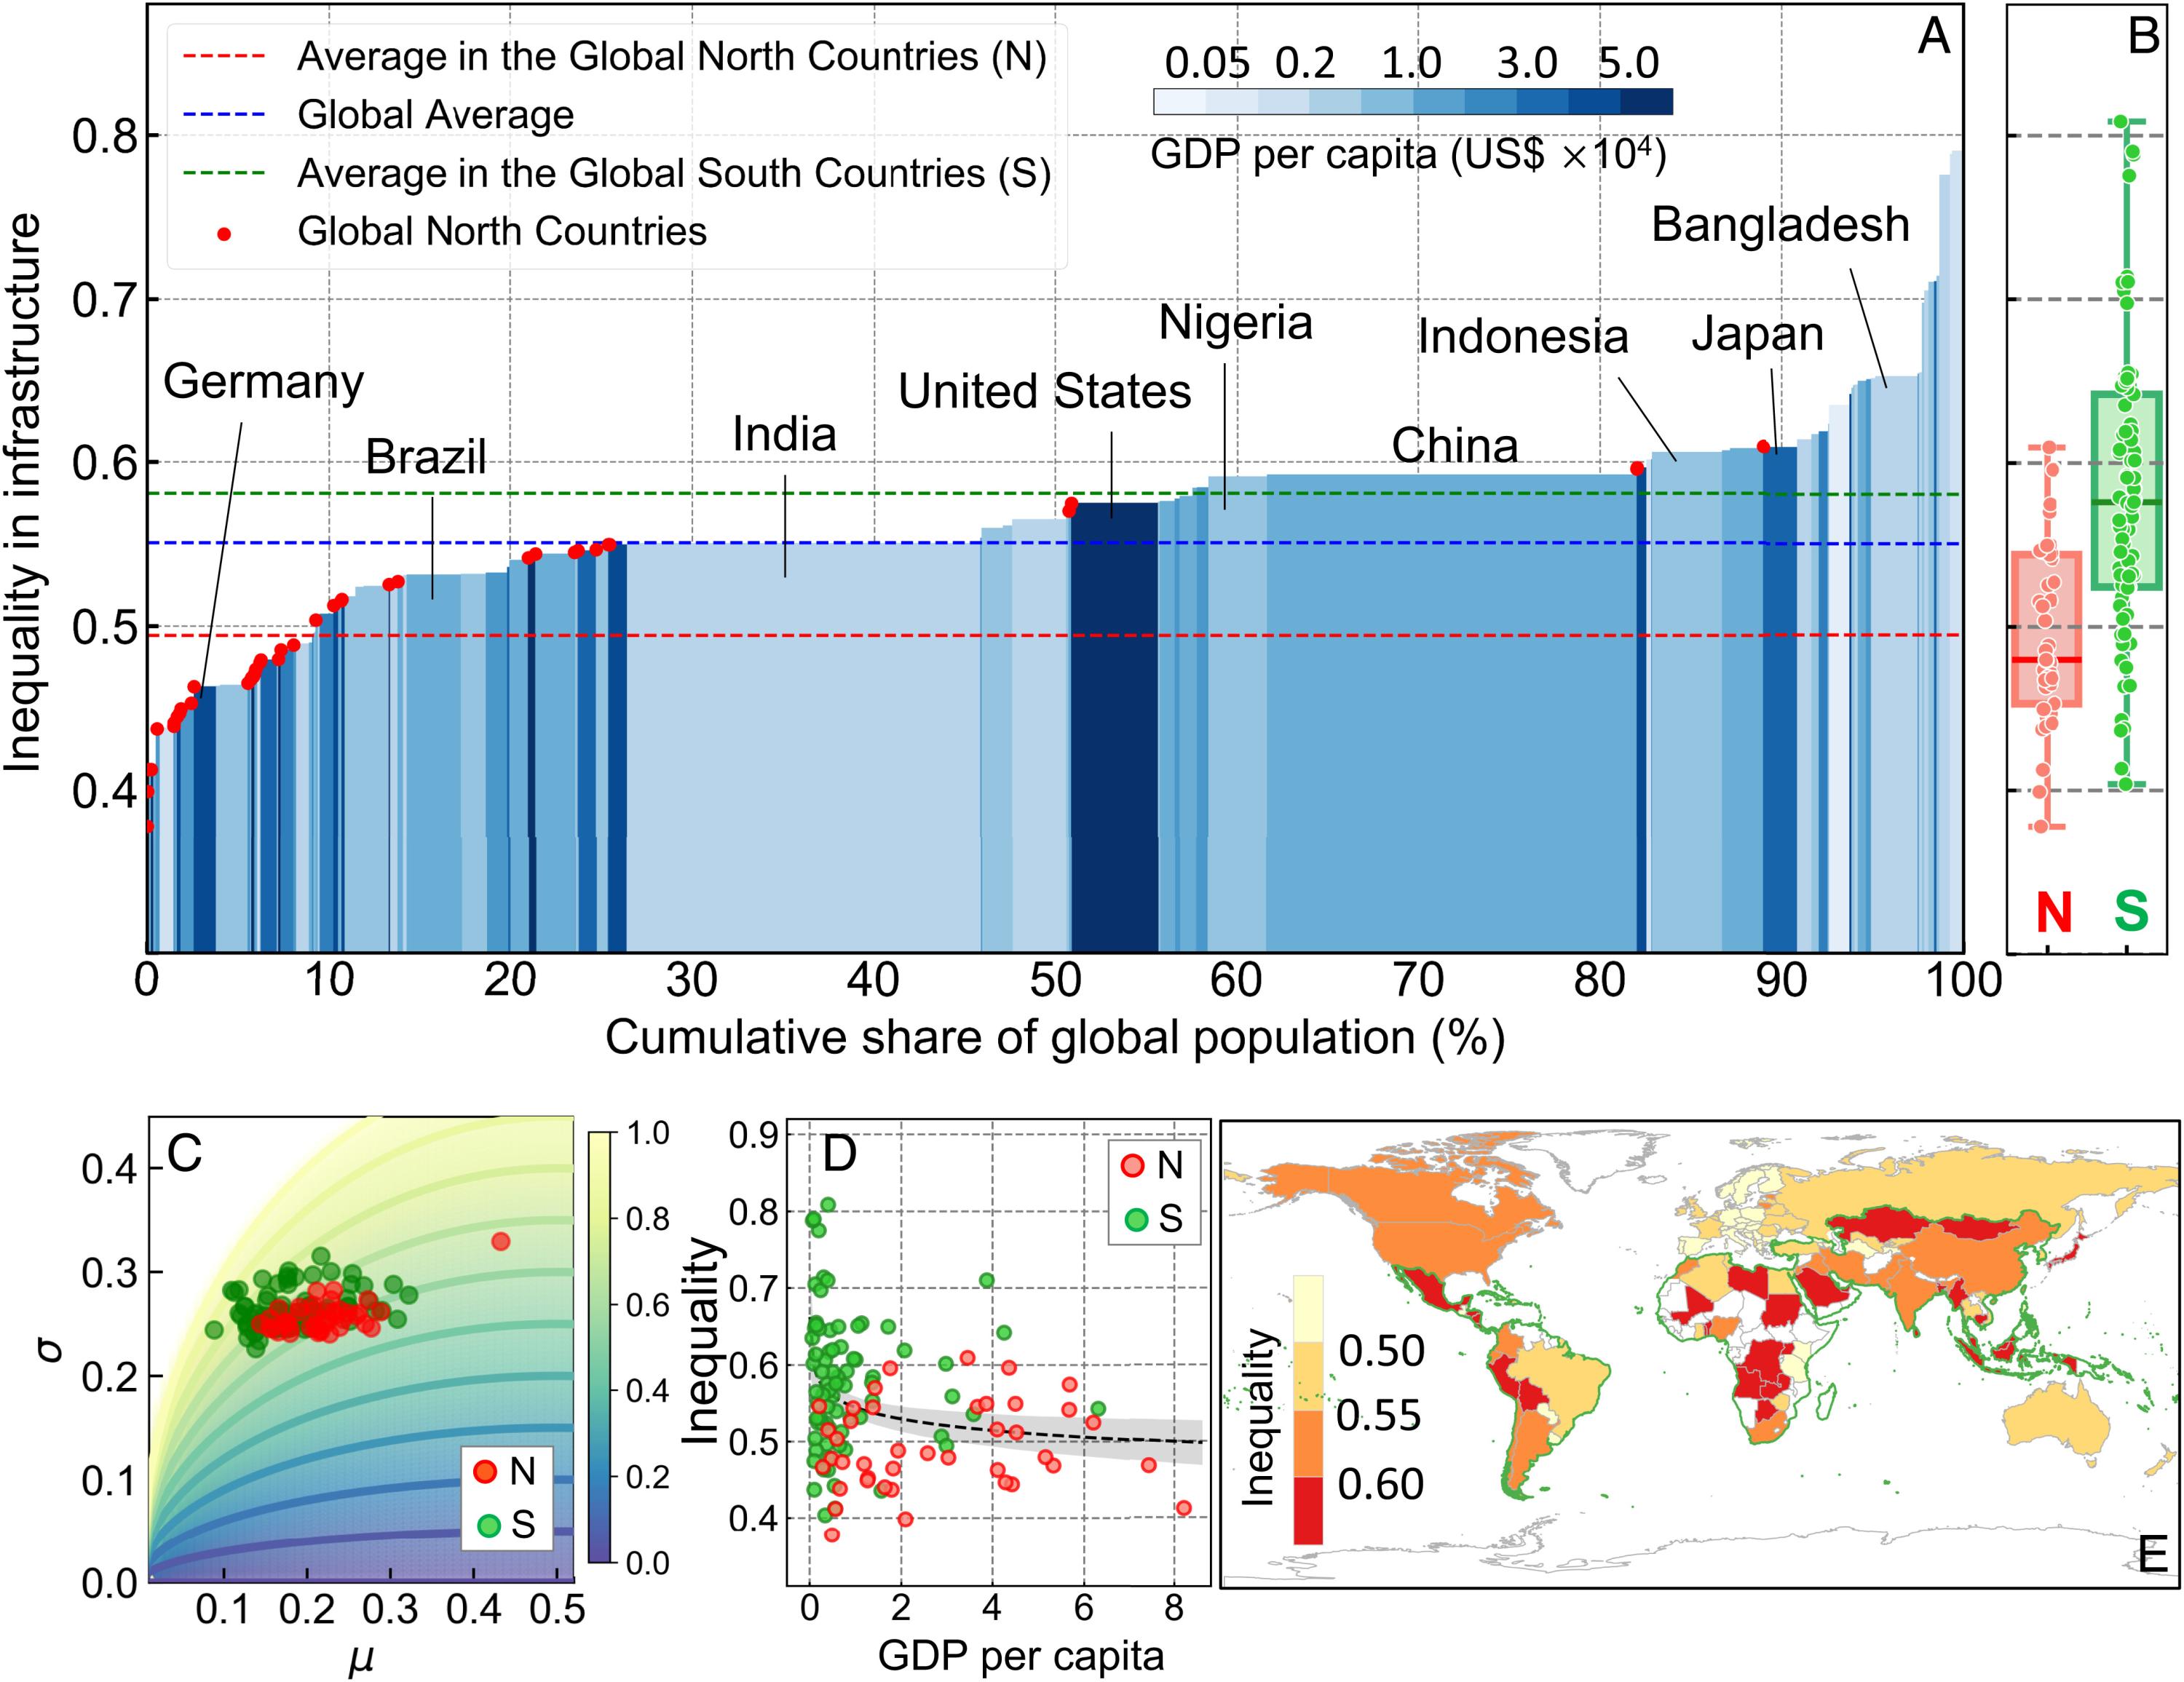
图 (A) 各国城市基础设施建设的不平等。红色、绿色和蓝色虚线分别是北半球国家(N;0.49)、南半球国家(S;0.58)和所有国家(0.55)的平均值。条形宽度代表每个国家的人口比例。颜色代表每个国家的人均GDP。红点表示北半球国家。 (B) 全球南方和北方国家的基础设施不平等。 (C) 全球南方和北方国家的基础设施不平等源自受 95% 分位数上限约束的已建成基础设施分布的平均值 (μ) 和 SD (σ)。 (D) 人均国内生产总值与基础设施不平等之间的关系。 (E) 基础设施不平等地图。地图中的绿色边界表示南半球国家。
原文链接:https://www.pnas.org/doi/10.1073/pnas.2214813119