文章信息:Steve Frolking, Richa Mahtta, Tom Milliman, Thomas Esch, & Karen C. Seto. (2024). Global urban structural growth shows a profound shift from spreading out to building up. Nature Cities: 1(9), 555–566. https://doi.org/10.1038/s44284-024-00100-1
整理人:杨文,2023级硕士生
整理时间:2024年9月28日
Abstract:We present a new study examining the dynamics of global urban building growth rates over the past three decades. By combining datasets for 1,550+ cities from several space-borne sensors—data from three scatterometers and settlement-built fraction based on Landsat-derived data—we find profound shifts in how cities expanded from the 1990s to the 2010s. Cities had both increasing building fractional cover and increasing microwave backscatter (correlating with building volume), but over the three decades, growth rates in building fraction decreased in most regions and large cities, while growth rates in backscatter increased in essentially all regions and cities. The divergence in rates of increase of these metrics indicates a shift from lateral urban expansion to more vertical urban development. This transition has happened in different decades and to different extents across the world’s cities. Growth rate increases were largest in Asian cities. This shift toward vertical development has profound consequences for material and energy use, local climate and urban living.
摘要:我们提出了一项新的研究,考察了过去三十年全球城市建筑增长率的动态。通过整合来自多个星载传感器的1550多个城市的数据集——来自三个散射仪的数据和基于陆地卫星数据的定居点建设部分——我们发现,从20世纪90年代到2010年代,城市的扩张方式发生了深刻的变化。城市的建筑覆盖率和微波后向散射率都在增加(与建筑体积相关),但在过去的三十年里,大多数地区和大城市的建筑面积增长率下降,而基本上所有地区和城市的后向散射增长率都在上升。这些指标增长率的差异表明,从横向城市扩张转向了更垂直的城市发展。这种转变发生在不同的几十年里,在世界各地的城市都有不同的程度。亚洲城市的增长率增幅最大。这种向垂直发展的转变对材料和能源使用、当地气候和城市生活产生了深远的影响。

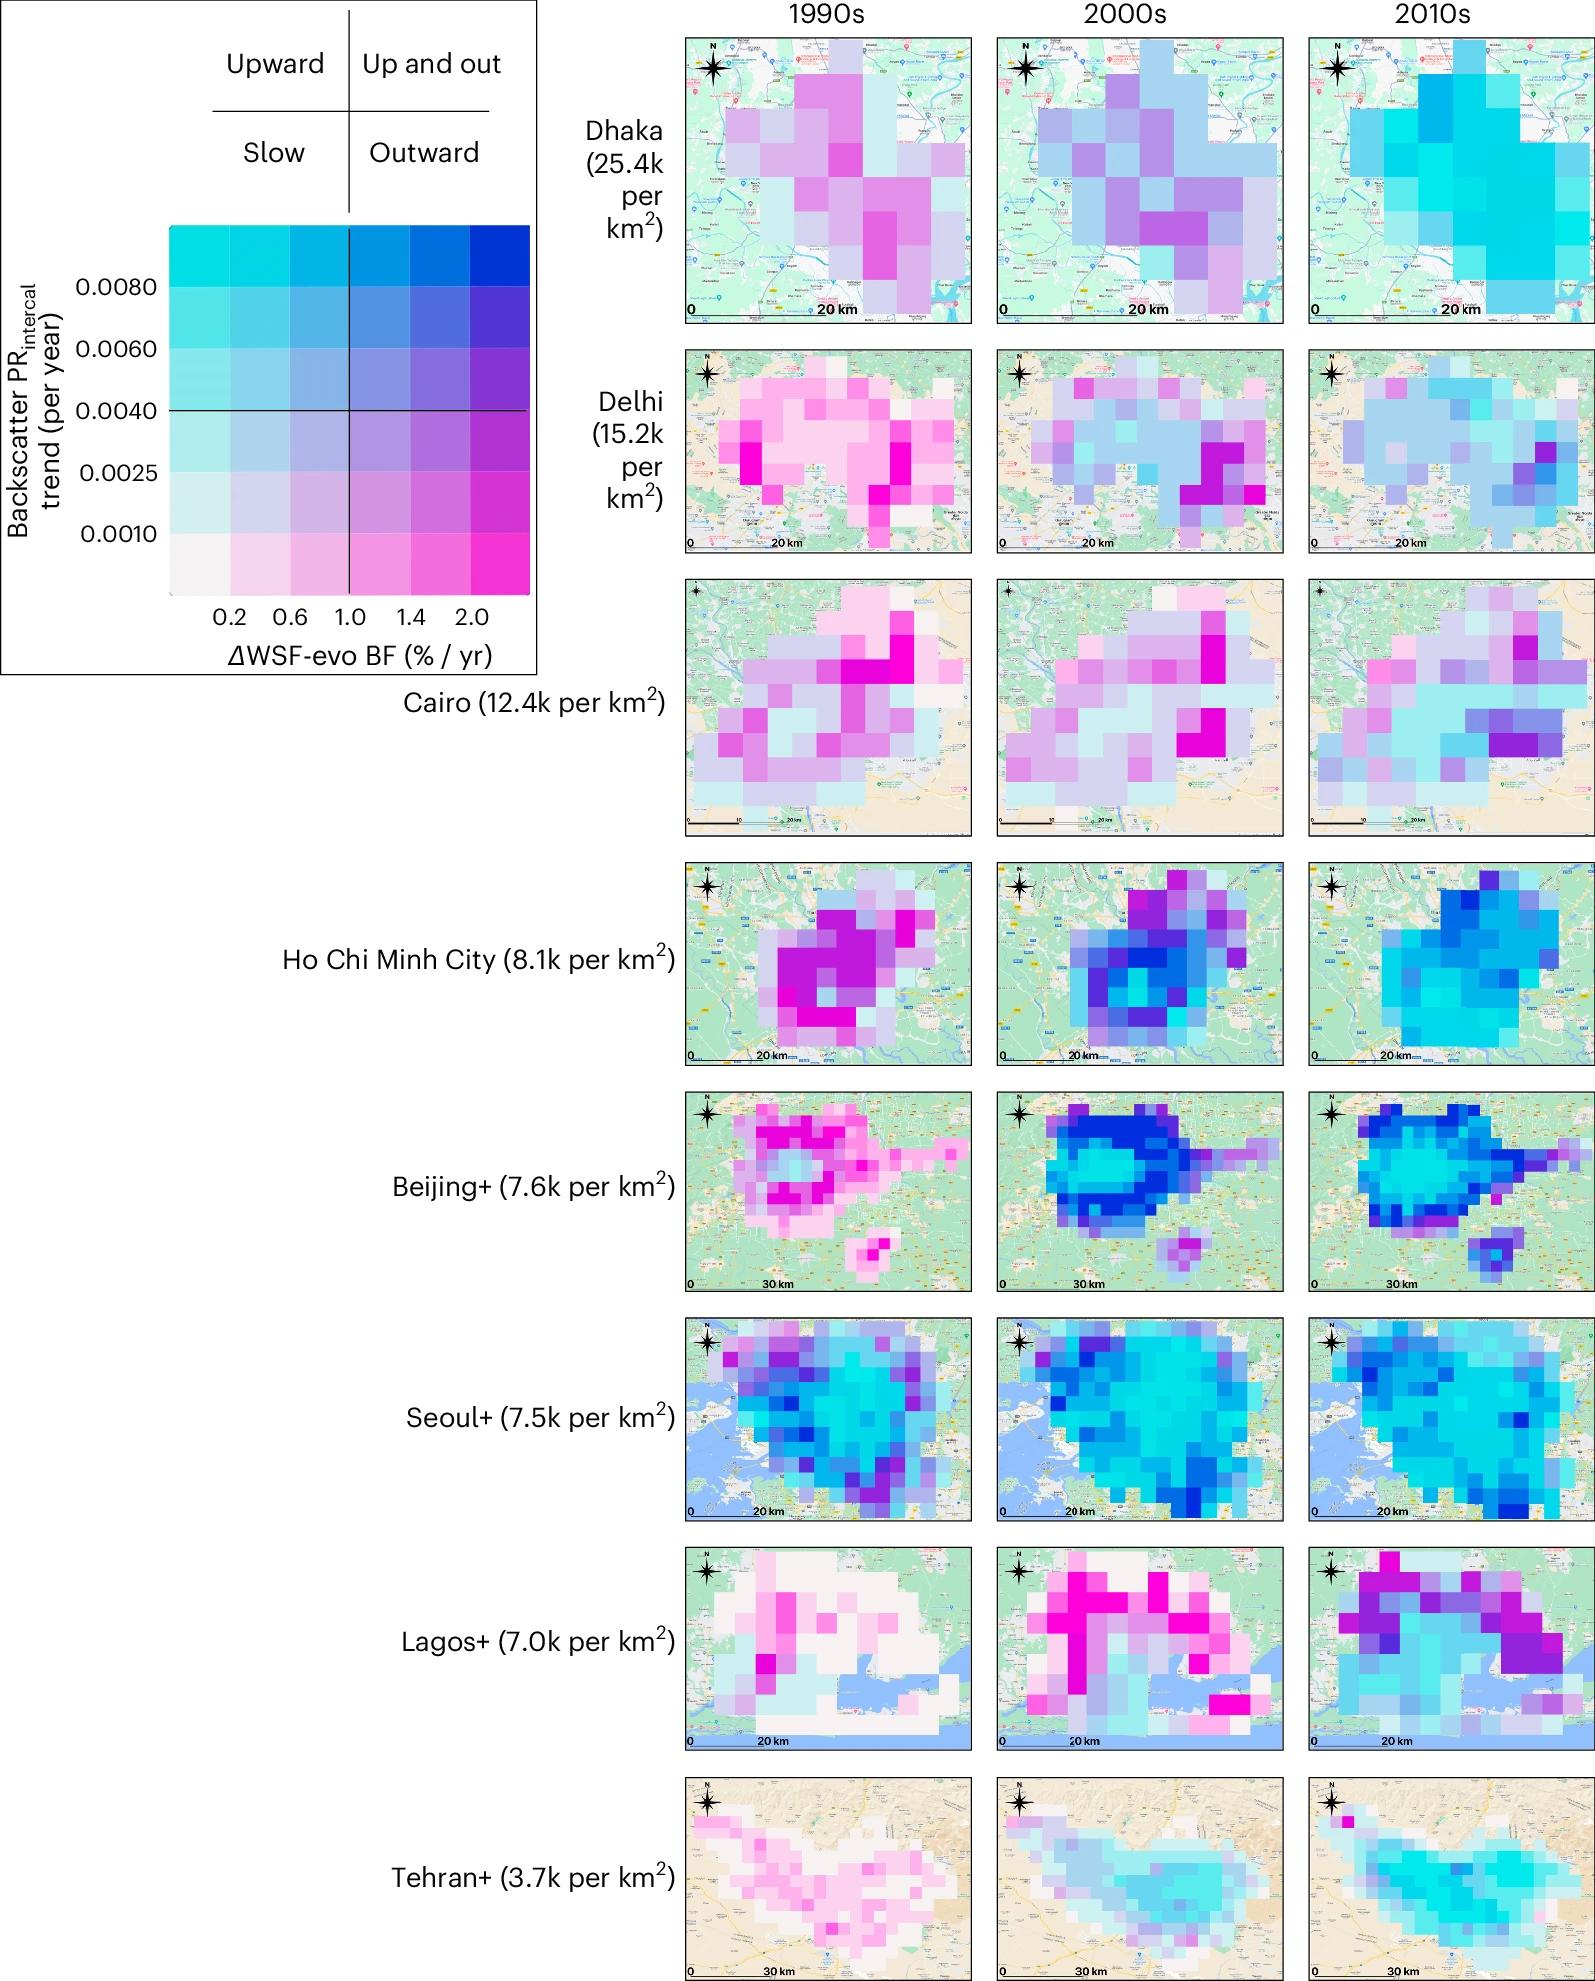
图 城市BF和PR十年增长率的双变量图
图以0.05°网格单元级别显示,八个特大城市(2014年人口>1000万)各有三个图(左:20世纪90年代;中:21世纪初;右:2010年代),括号中列出了2014年的平均城市人口密度。1993-2000年、1999-2009年和2010-2015年的WSF evo BF增长率(每年百分比),以及ERS(1993-2000)、QSCAT(1999-2009)和ASCAT(2010-2021)的反向散射PR趋势(每年),每个指标分为六个范围。36个双变量箱分为四大增长类别(图例)。北京+地图包括北京东南部较小的廊坊MUA。背景图用于上下文,不用于数据。2022年谷歌地图版权所有。地图数据版权归Google Roads所有。

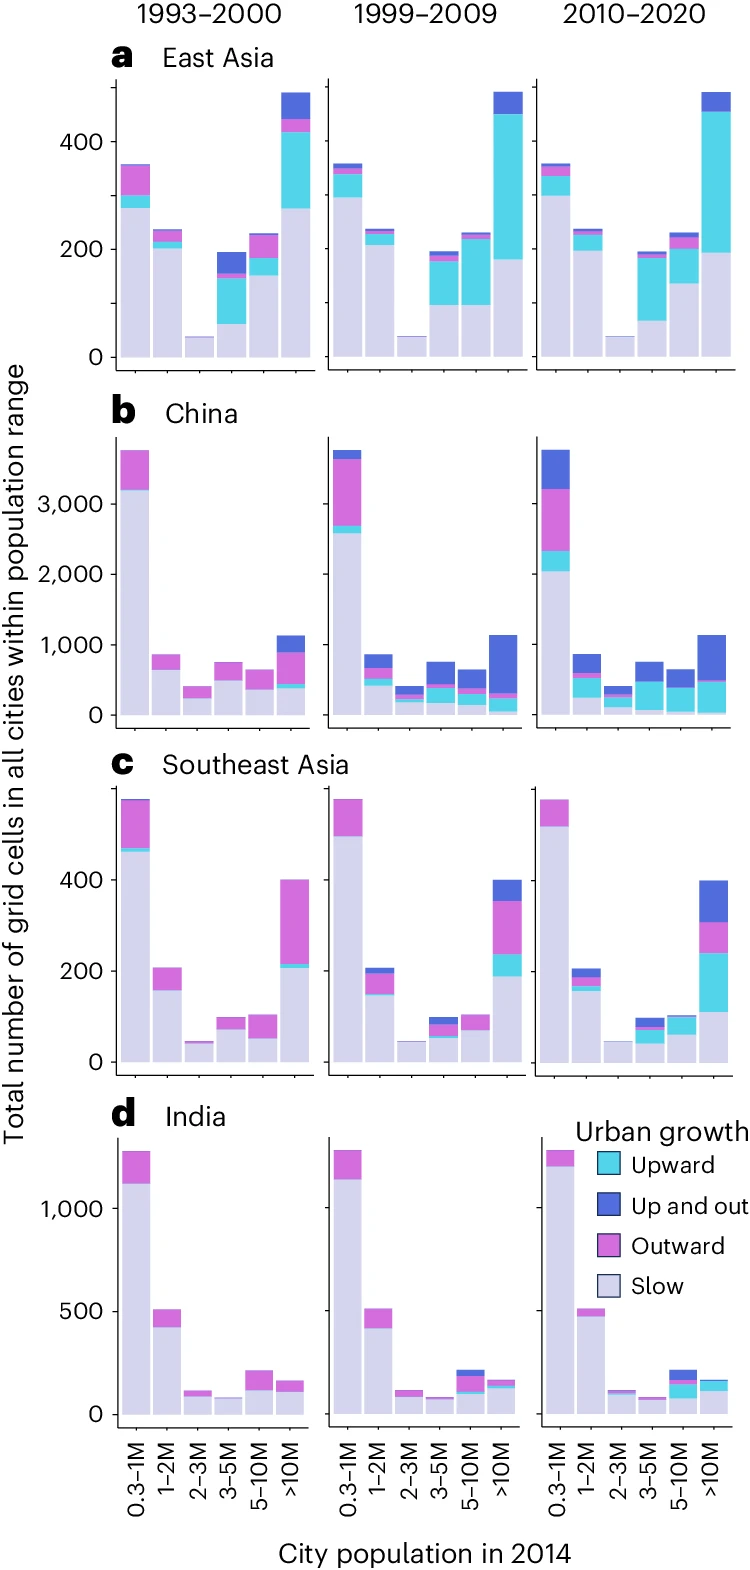
图 东亚和南亚城市电网单元建设增长率十年分布的区域差异
a–d,网格单元计数与城市人口相对应。对于东亚(a)、中国(b)、东南亚(c)和印度(d)等每个地区,城市按2014年总人口进行分类(Taubenbock等人,2019),然后将聚集的网格单元划分为四个城市增长率类别;见图1中的图例。其他地区的结果见扩展数据图3。
原文链接:https://www.nature.com/articles/s44284-024-00100-1#Fig2
节选转引:https://mp.weixin.qq.com/s/Y5ZZf-BTmMe5rfHrjnwQkw