文章信息:Yang Long, Yang Yi, Shen Ye, Yang Jiachuan, ZhengGuang, James Smith & Dev Niyogi. Urban development pattern’s influence on extreme rainfall occurrences. Nature Communications: 15, 3997 (2024). https://doi.org/10.1038/s41467-024-48533-5.
推荐人:李卓起,2023级硕士生
整理人:杨 文,2023级硕士生
整理时间:2024年5月27日
Abstract: Growing urban population and the distinct strategies to accommodate them lead to diverse urban development patterns worldwide. While local evidence suggests the presence of urban signatures in rainfall anomalies, there is limited understanding of how rainfall responds to divergent urban development patterns worldwide. Here we unveil a divergence in the exposure to extreme rainfall for 1790 inland cities globally, attributable to their respective urban development patterns. Cities that experience compact development tend to witness larger increases in extreme rainfall frequency over downtown than their rural surroundings, while the anomalies in extreme rainfall frequency diminish for cities with dispersed development. Convection-permitting simulations further suggest compact urban footprints lead to more pronounced urban-rural thermal contrasts and aerodynamic disturbances. This is directly responsible for the divergent rainfall responses to urban development patterns. Our analyses offer significant insights pertaining to the priorities and potential of city-level efforts to mitigate the emerging climate-related hazards, particularly for countries experiencing rapid urbanization.
摘要:不断增长的城市人口和适应这些人口的独特战略导致了全球不同的城市发展模式。虽然当地证据表明降雨异常中存在城市特征,但对降雨如何应对全球不同的城市发展模式的了解有限。在这里,我们揭示了全球1790个内陆城市在极端降雨暴露方面的差异,这归因于它们各自的城市发展模式。经历紧凑发展的城市往往会看到市区极端降雨频率比农村环境增加更多,而发展分散的城市极端降雨频率的异常减少。对流允许的模拟进一步表明,紧凑的城市足迹导致更明显的城乡热对比和空气动力学扰动。这是对城市发展模式的不同降雨反应的直接原因。我们的分析提供了关于城市一级减轻新出现的气候相关危害的优先事项和潜力的重要见解,特别是对于经历快速城市化的国家。

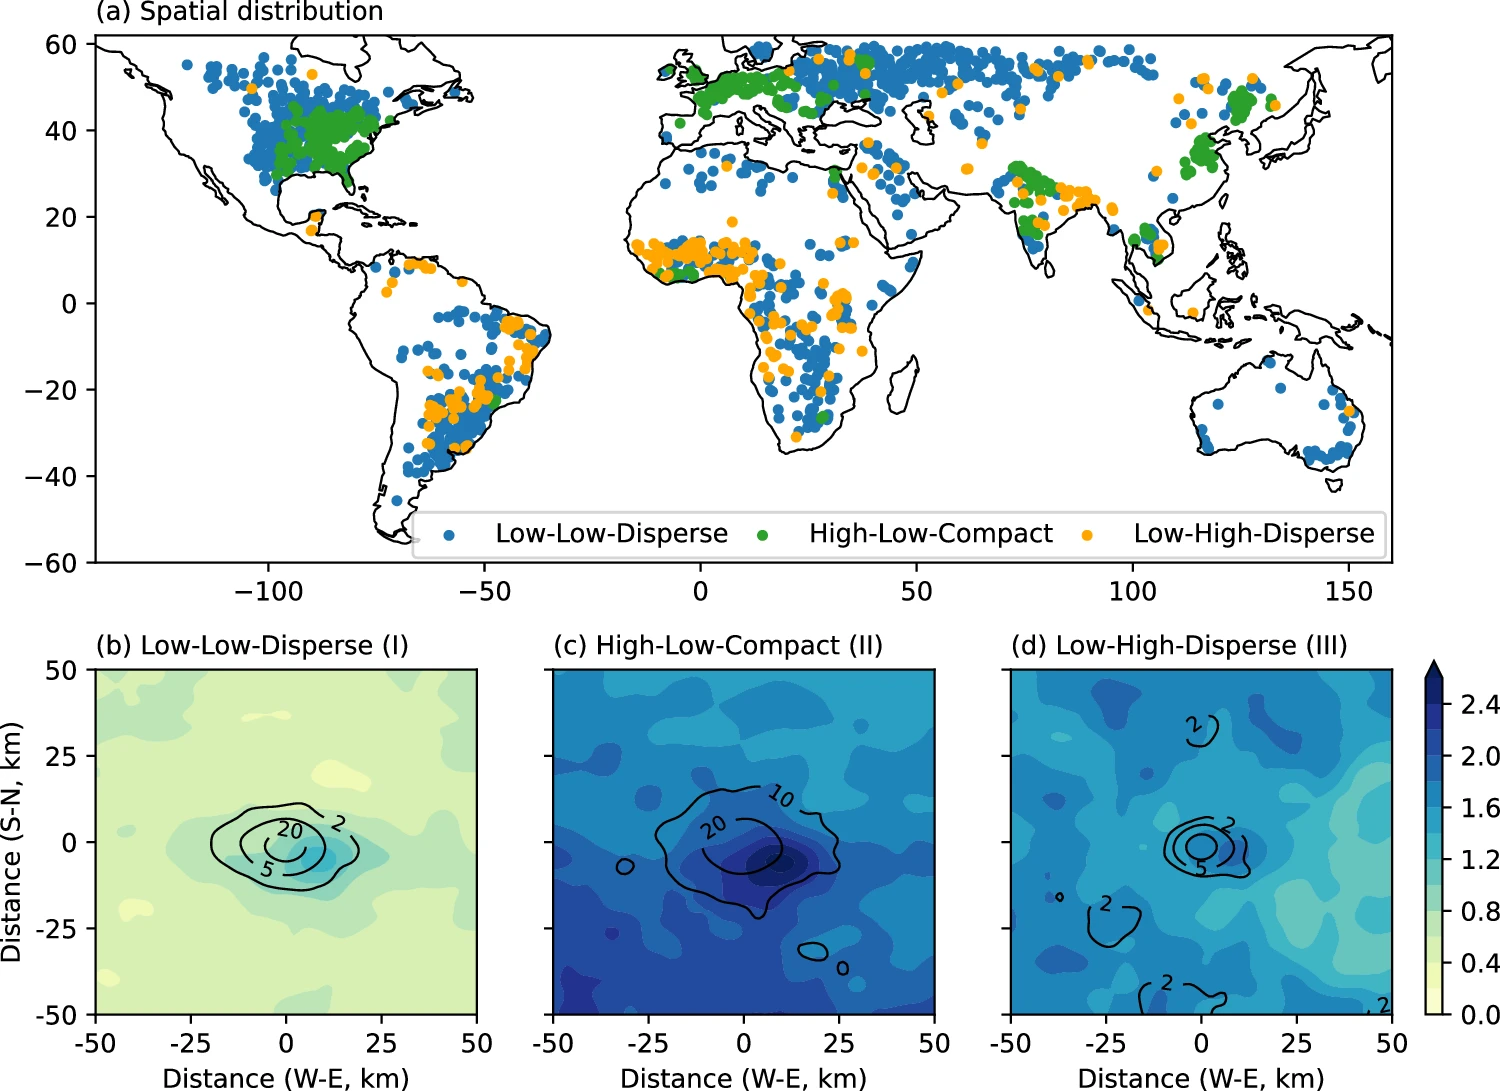
图 不同的城市发展模式和相关的空间降雨模式异常。
a具有三种不同发展模式的城市的空间分布;(b–d)2000-2005年至2016-2020年期间,具有不同发展模式的不同城市组的极端降雨频率(即超过雨天的第99个百分位数的日降雨量,以阴影表示)的综合平均变化率。b第一组(包括城市覆盖率较低的城市),城市面积增幅较小,景观形状指数略有上升,即“低-低-分散”组团;(c)第二组(包括城镇覆盖率较高的城市)、城市面积增幅较低,景观形状指数略有下降,即“高-低-紧凑”组团。轮廓显示了城市像素的归一化数量(即,通过划分域内的最大值,以百分比为单位),提供了城市边界的近似值。

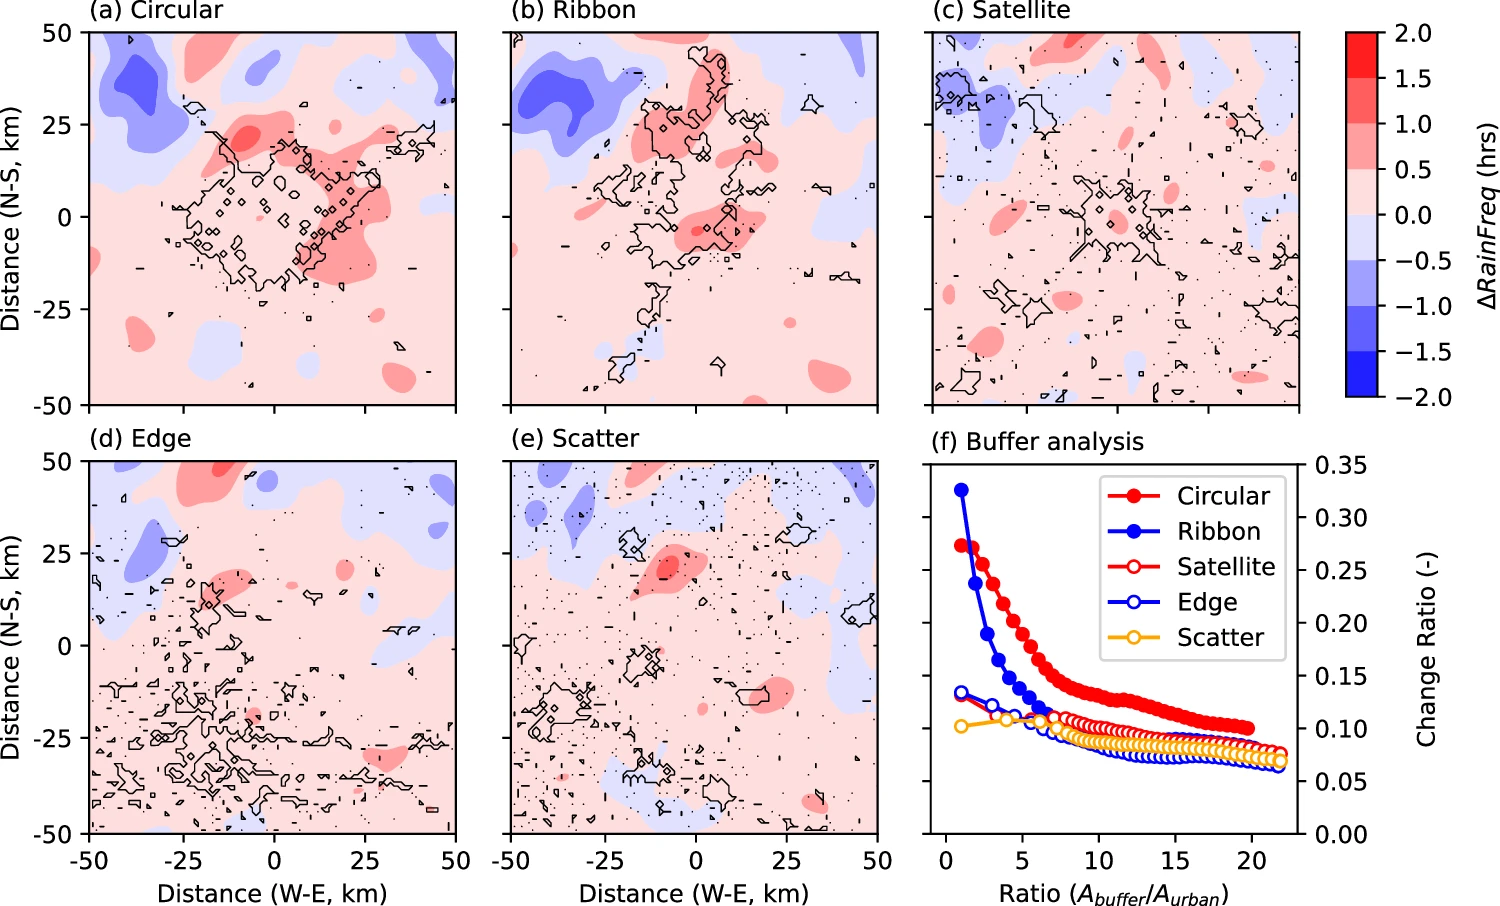
图 极端降雨发生差异的空间模式(以降雨率超过10的小时数表示) mm/h)。
a圆形,(b)带状,(c)卫星,(d)边缘,(e)散射。城市边界及其缓冲区内的平均变化率,即表示为(Rurban-Rno city)/(Rurban+Rno city。(a)-(e)中的轮廓突出了每种场景的城市足迹。

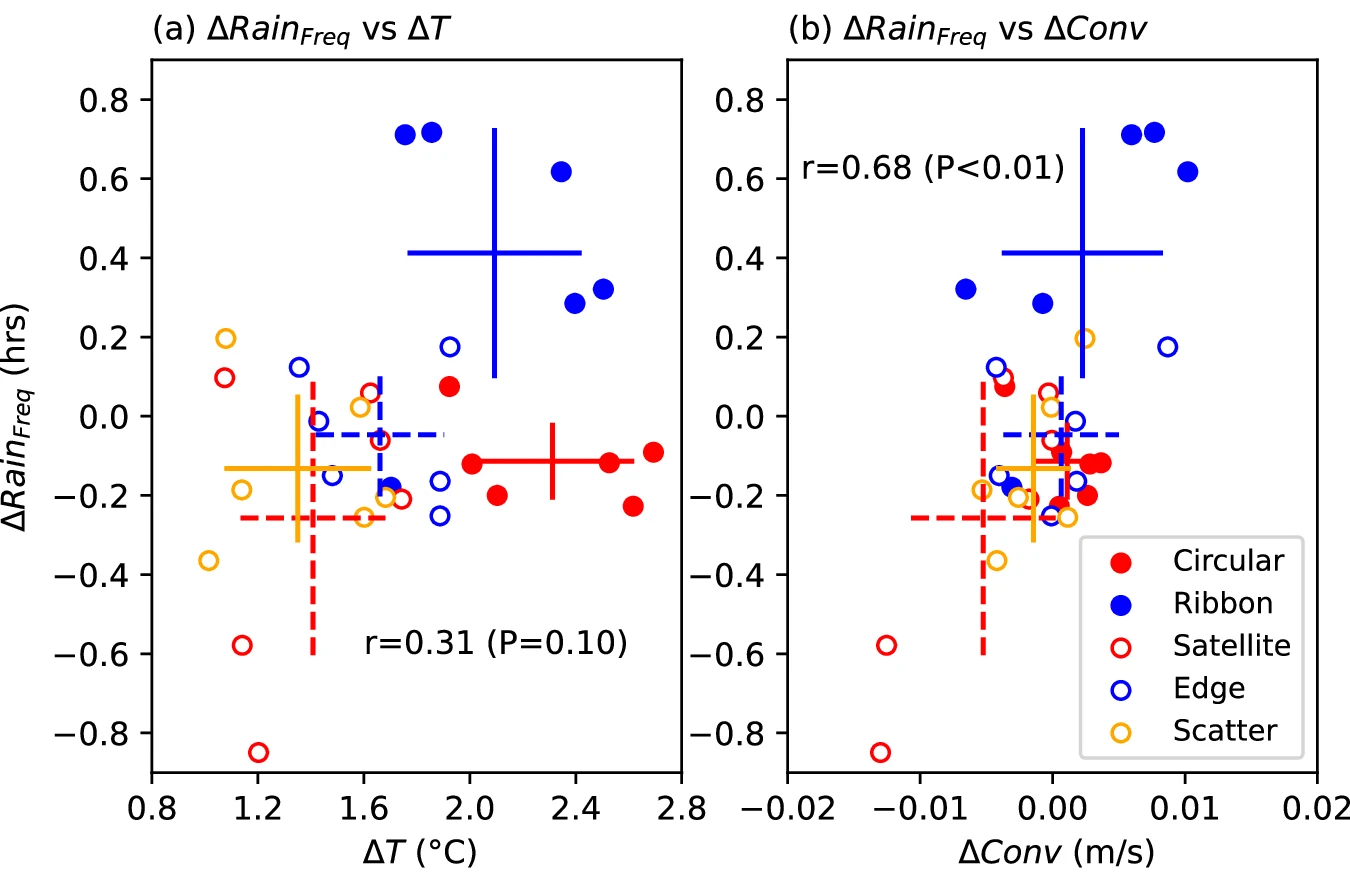
图 城市边界内极端降雨发生的变化(∆RainFreq,以小时为单位)与责任变量之间的关系。
(a)2米的温度;(b) 850百帕时的垂直速度。每个圆圈代表对应城市场景的单个集合成员。相交线显示每个城市场景的标准误差。变量之间的Pearson相关系数及其相应的统计显著性显示在每个子场景标题中。
原文链接:https://www.nature.com/articles/s41467-024-48533-5#Fig2
节选转引:https://mp.weixin.qq.com/s/PqQHMz2nfbUGNU1nSQnFEg