文章信息:Kai Cheng, Yanjun Su, Hongcan Guan, Shengli Tao, Yu Ren, Tianyu Hu, Keping Ma, Yanhong Tang, Qinghua Guo. Mapping China’s planted forests using high resolution imagery and massive amounts of crowdsourced samples. ISPRS Journal of Photogrammetry and Remote Sensing, 2023, 196: 356–371. https://doi.org/10.1016/j.isprsjprs.2023.01.005
整理人:闫甲祺,2024级硕士研究生
整理时间:2025年1月11日
Abstract: Tree planting has been suggested as a potentially effective solution for mitigating climate change. China has implemented the world’s largest afforestation and reforestation project since the 1970s, but high-resolution maps of China’s planted forests remain unavailable. In this study, we explored the use of multi-source remote sensing images and crowdsourced samples to produce the first high-resolution (30-m) map of China’s planted forests. We constructed a Google Earth Engine (GEE)-based mapping framework using spectral, temporal, structural, textural and topographic features derived from Landsat and Sentinel-1 time series imagery, Digital Elevation Model (DEM) and Chinese Forest Canopy Height (CFCH) data. Over 300,000 high-quality crowdsourced samples were collected for training the mapping pipeline. Validation against independent field samples indicated an accuracy of 84.93 % and an F1 score of 0.85. The uncertainty map of each pixel was also constructed and showed that the areas of low and medium uncertainties accounted for 38.27 % and 50.98 % of the total area, respectively, indicating the high estimation reliabilities of the planted forest map. We show that China’s planted forests in the year of 2020 had a total area of 769853.01 km2, accounting for 31.30 % of the world’s total planted forests. The majority (77.45 %) of China’s planted forests were located in the Eastern, Center-South, and Southwestern regions. By further assessing the performance of the image features used to map the planted forests, we found that temporal features are key to identifying the planted forests in East and Center-South of China, where they are mainly timber plantations. However, structural and textural features were more useful for locating the planted forests in North and Northeast of China, where are dominated by planted shelterbelts. Our study demonstrated that combining crowdsourced samples with high-resolution satellite images allows mapping planted forests with unprecedented resolution (30-m) across large areas. Our map could contribute to the sustainable management of China’s forests and a more accurate quantification of the carbon balance of China’s natural ecosystems.
摘要:植树被认为是缓解气候变化的潜在有效解决方案。自20世纪70年代以来,中国实施了世界上最大的造林和再造林项目,但中国人工林的高分辨率地图仍然无法获得。在这项研究中,我们探索使用多源遥感图像和众包样本来制作第一张中国人工林高分辨率(30米)地图。我们利用来自 Landsat 和 Sentinel-1 时间序列图像、数字高程模型 (DEM) 和中国森林冠层高度 (CFCH) 数据的光谱、时间、结构、纹理和地形特征构建了基于 Google Earth Engine (GEE) 的测绘框架。收集了超过 300,000 个高质量的众包样本来训练测绘管道。针对独立现场样本的验证表明准确度为 84.93%,F1 分数为 0.85。还构建了每个像素的不确定性图,结果表明,低不确定性和中不确定性区域分别占总面积的38.27%和50.98%,表明人工林图的估计可靠性较高。我们显示,2020年中国人工林总面积为769853.01平方公里,占世界人工林总面积的31.30%。中国的人工林大部分(77.45%)分布在东部、中南和西南地区。通过进一步评估用于绘制人工林地图的图像特征的性能,我们发现时间特征是识别中国东部和中南部人工林的关键,这些地区主要是用材林。然而,结构和纹理特征对于定位中国北部和东北部的人工林更为有用,这些地区以人工防护林为主。我们的研究表明,将众包样本与高分辨率卫星图像相结合,可以以前所未有的分辨率(30 米)绘制大面积的人工林地图。我们的地图可以为中国森林的可持续管理和更准确地量化中国自然生态系统的碳平衡做出贡献。
1. 研究背景
2. 研究意义
-
填补数据空白: 本研究利用多源遥感数据和众包样本,生成了中国首张30米分辨率的人工林地图,为可持续森林管理和生态系统碳平衡的准确量化提供了重要依据。
-
支持碳中和目标: 研究结果有助于理解人工林对碳汇的贡献,支持中国2060年碳中和目标的实现。
-
生态系统服务评估: 研究结果为评估森林生态系统服务(如生物多样性保护、水源涵养等)提供了基础数据。
3. 研究方法
-
数据来源: 研究利用了Landsat和Sentinel-1卫星影像、数字高程模型(DEM)和中国森林冠层高度(CFCH)数据,结合超过30万个高质量的众包样本,构建了基于Google Earth Engine(GEE)的分类框架。
-
特征提取: 提取了光谱、时间、结构、纹理和地形特征,用于区分人工林和天然林。
-
分类方法: 采用简单非迭代聚类(SNIC)和随机森林(RF)算法进行分类,生成中国人工林地图。
-
准确性评估: 使用独立实地样本验证分类结果,计算总体准确性和F1分数,并与国家森林资源清查数据进行对比分析。
4. 研究主要结论
-
人工林分布: 2020年中国人工林总面积为769,853.01平方公里,占全球人工林面积的31.30%。人工林主要分布在东南、中心南部和西南地区,占总面积的77.45%。
-
特征重要性: 时间特征在东部和中心南部地区识别人工林时最为关键,而结构和纹理特征在北部和东北部地区更为重要。
-
准确性评估: 分类结果的总体准确性和F1分数分别为84.93%和0.85,表明分类结果具有较高的可靠性。与国家森林资源清查数据的对比分析也显示出显著的线性关系(R²=0.93,P<0.001)。
5. 研究展望
-
数据改进: 未来研究可以通过融合更多类型的遥感数据(如Lidar、SAR)和实地调查数据,进一步提高森林地图的精度和可靠性。
-
生态系统服务评估: 研究结果可为评估森林生态系统服务(如生物多样性保护、水源涵养等)提供基础数据,支持更全面的生态系统管理决策。
-
政策调整: 研究结果表明,未来森林管理政策需要在保护天然林和扩大人工林之间找到平衡,以实现生态效益和经济利益的双赢。
6. 研究主要图表:
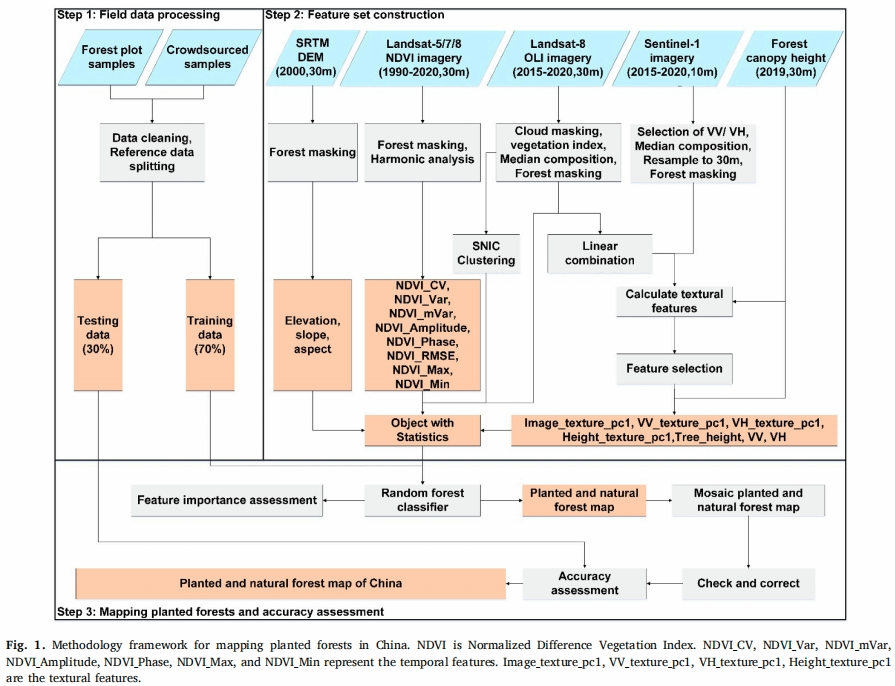
01 绘制中国种植森林地图的方法框架
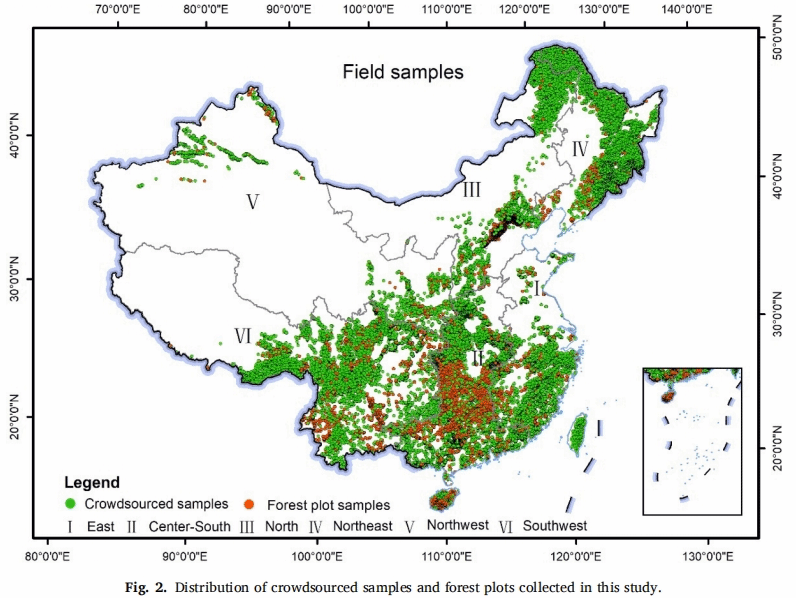
02 本研究中收集的众包样本和森林样地的分布情况
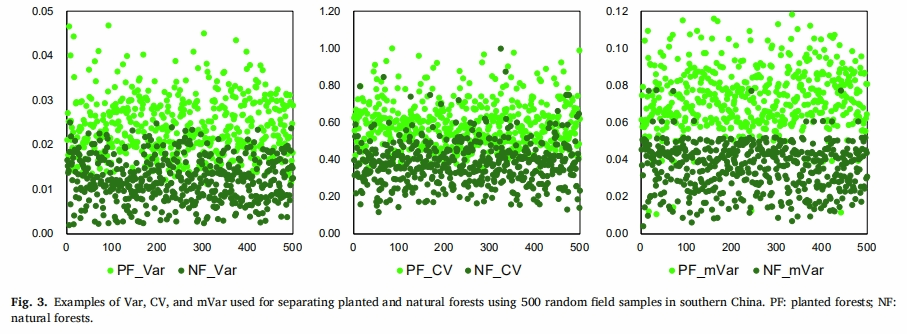
03 Var、CV和mVar用于分离种植森林和自然森林,使用了在中国南方的500个随机场样本
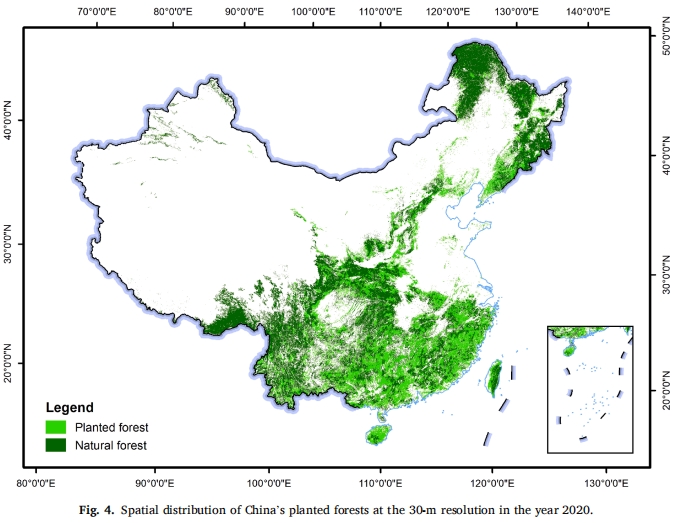
04 2020年中国30米分辨率的空间分布
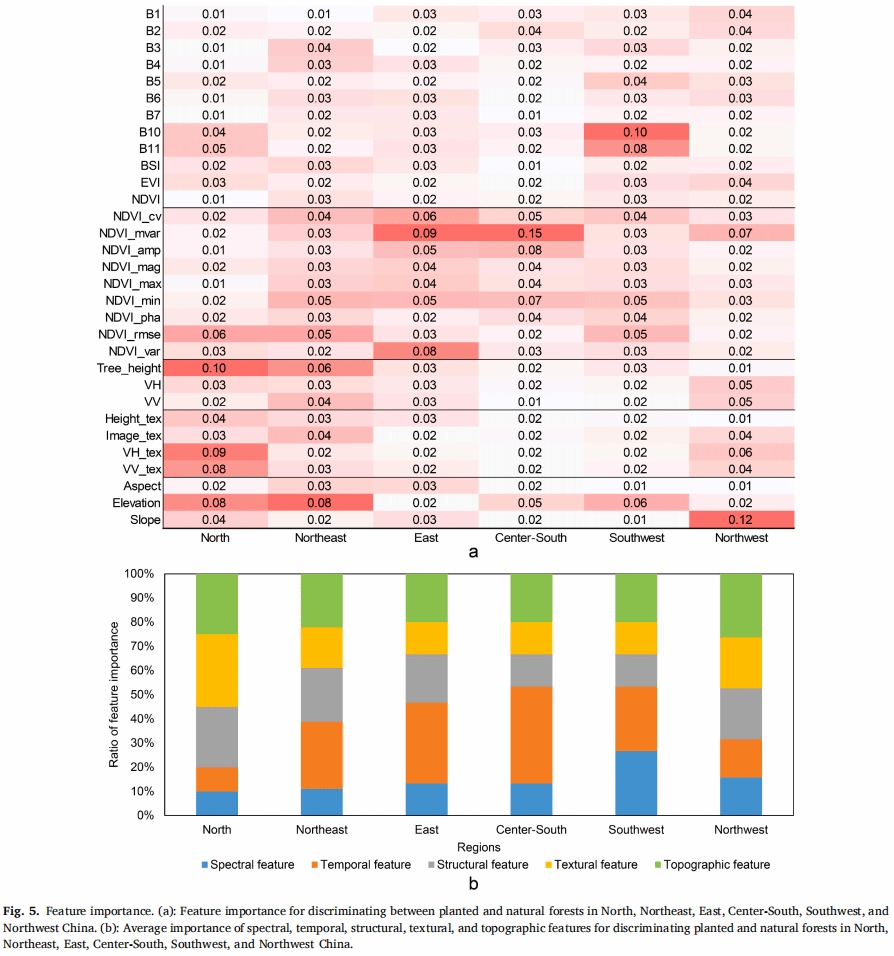
05 特征重要性
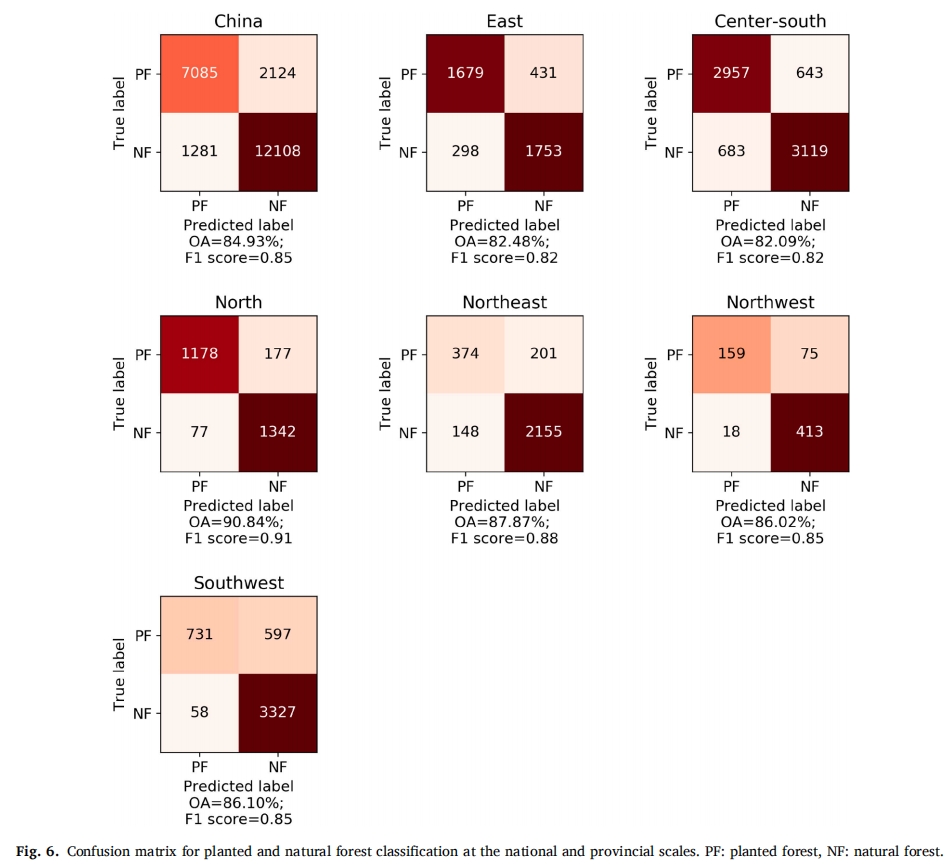
06 在国家和省级尺度上进行种植和自然森林分类的混淆矩阵
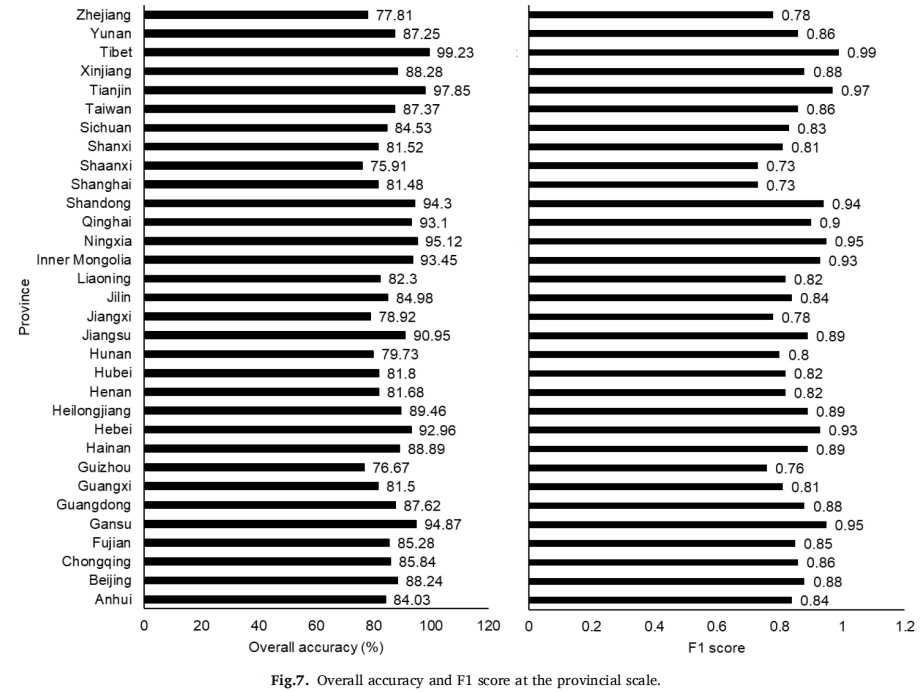
07 省级级总体准确性和F1分
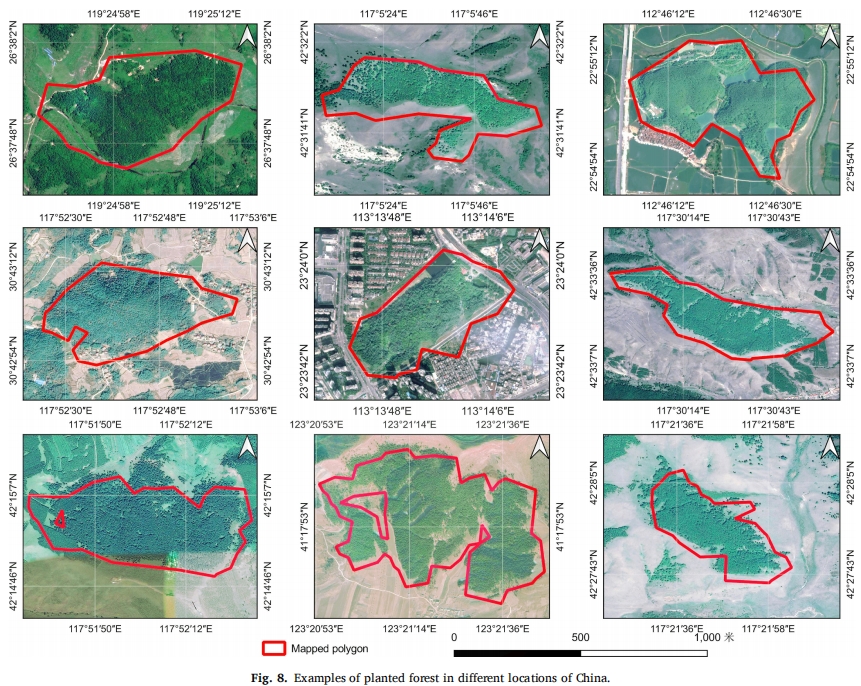
08 中国不同地区种植森林的例子
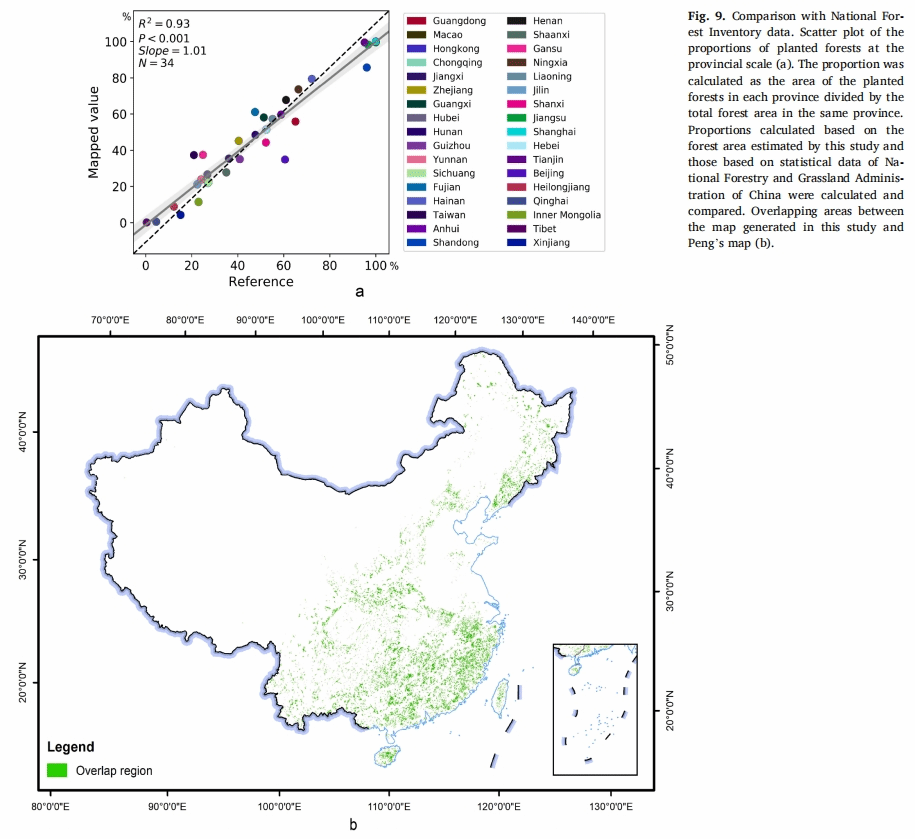
09 与国家森林目录数据的比较
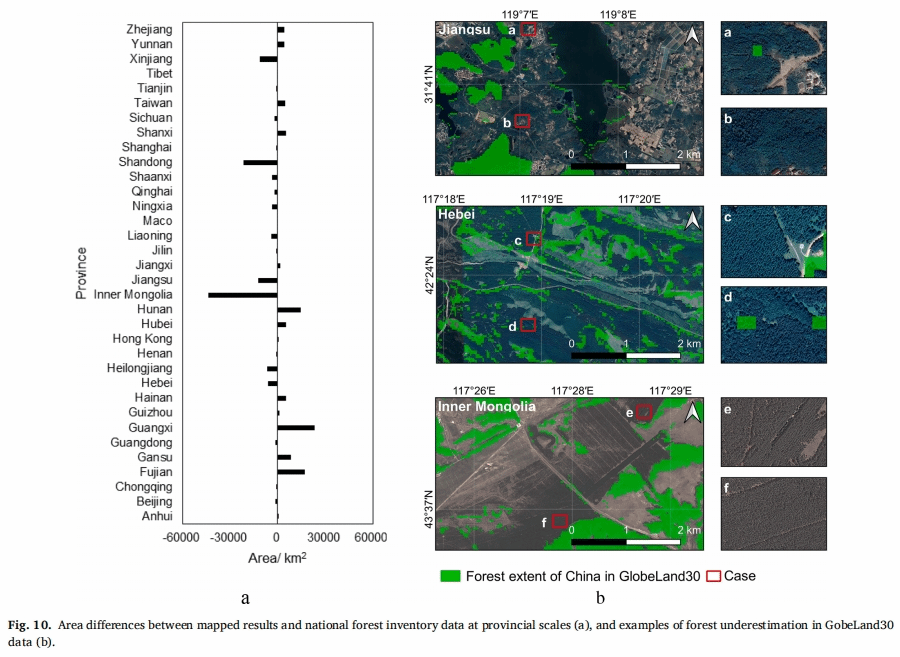
10 在省级尺度(a)上的映射结果与国家森林清单数据之间的面积差异,以及GobeLand30数据(b)中森林低估的例子
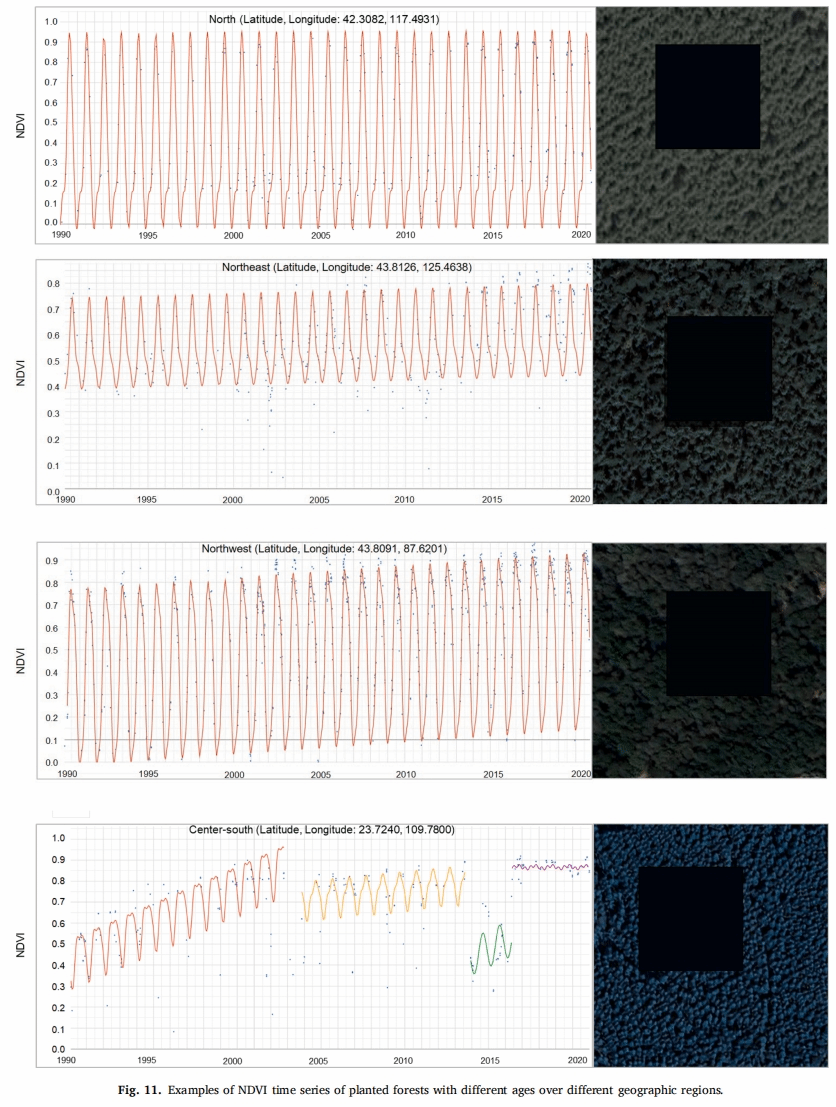
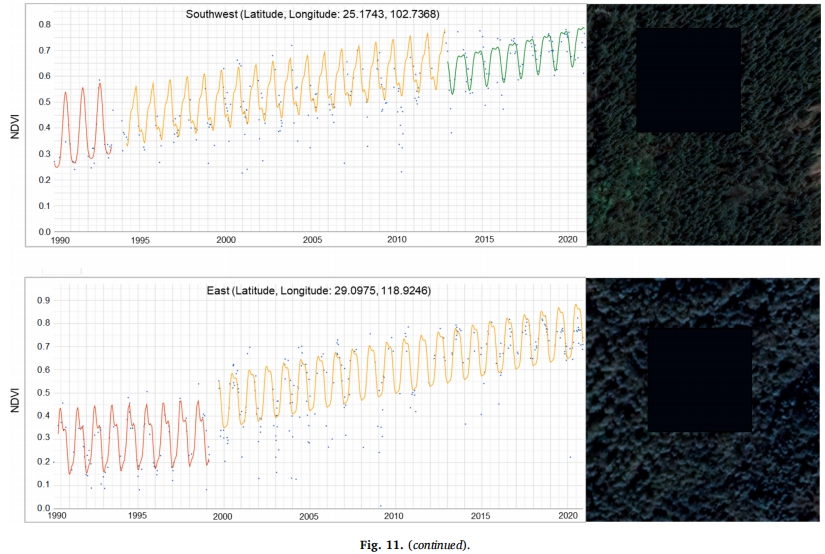
11 不同地理区域不同年龄种植林的NDVI时间序列的例子
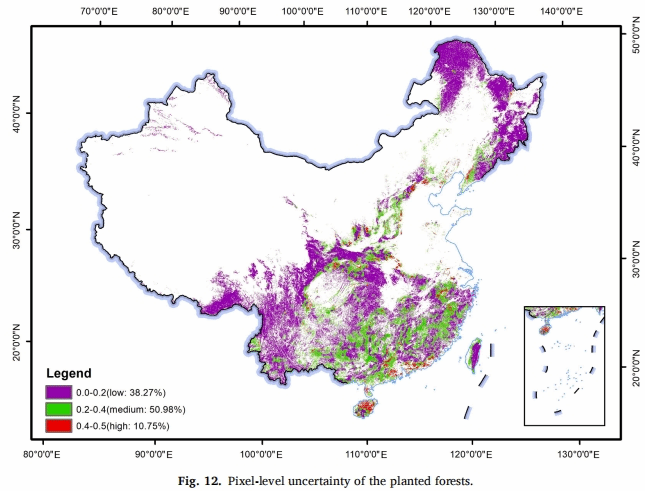
12 种植森林的像素级不确定性
原文链接:https://www.sciencedirect.com/science/article/pii/S0924271623000114
原文转引:https://mp.weixin.qq.com/s/DUEyOmYqGyBUHzV5XD6t6Q
