文章信息:Zhao Chuang, Piao Shilong, Huang Yao, Wang Xuhui, Philippe Ciais, Huang Mengtian, Zeng Zhenzhong & Peng Shushi. (2016). Field warming experiments shed light on the wheat yield response to temperature in China. Nature Communications: 7(1), 13530. https://doi.org/10.1038/ncomms13530
整理人:杨文,2023级硕士生
整理时间:2024年7月7日
Abstract: Wheat growth is sensitive to temperature, but the effect of future warming on yield is uncertain. Here, focusing on China, we compiled 46 observations of the sensitivity of wheat yield to temperature change (SY,T, yield change per °C) from field warming experiments and 102SY,Testimates from local process-based and statistical models. The averageSY,Tfrom field warming experiments, local process-based models and statistical models is −0.7±7.8(±s.d.)% per °C, −5.7±6.5% per °C and 0.4±4.4% per °C, respectively. Moreover,SY,Tis different across regions and warming experiments indicate positiveSY,Tvalues in regions where growing-season mean temperature is low, and water supply is not limiting, and negative values elsewhere. Gridded crop model simulations from the Inter-Sectoral Impact Model Intercomparison Project appear to capture the spatial pattern ofSY,Tdeduced from warming observations. These results from local manipulative experiments could be used to improve crop models in the future.
摘要:小麦的生长对温度非常敏感,但未来升温对产量的影响还不确定。在这里,关注中国,我们整理了46项关于小麦产量对温度变化敏感度(SY,T,每摄氏度产量变化)的实地加热实验观察结果和来自本地基于过程和统计模型的102个SY,T估算值。实地加热实验、本地基于过程模型和统计模型的平均SY,T分别为每摄氏度−0.7±7.8(±s.d.)%、−5.7±6.5%和0.4±4.4%。此外,SY,T在不同区域存在差异,加热实验表明,在生长季平均温度较低且水供应不受限制的区域,SY,T值为正,在其他地方为负。来自跨部门影响模型相互比较项目的格网作物模型模拟似乎捕捉到了从加热观察中推导出的SY,T的空间模式。来自本地操纵实验的这些结果可能被用来改善未来的作物模型。

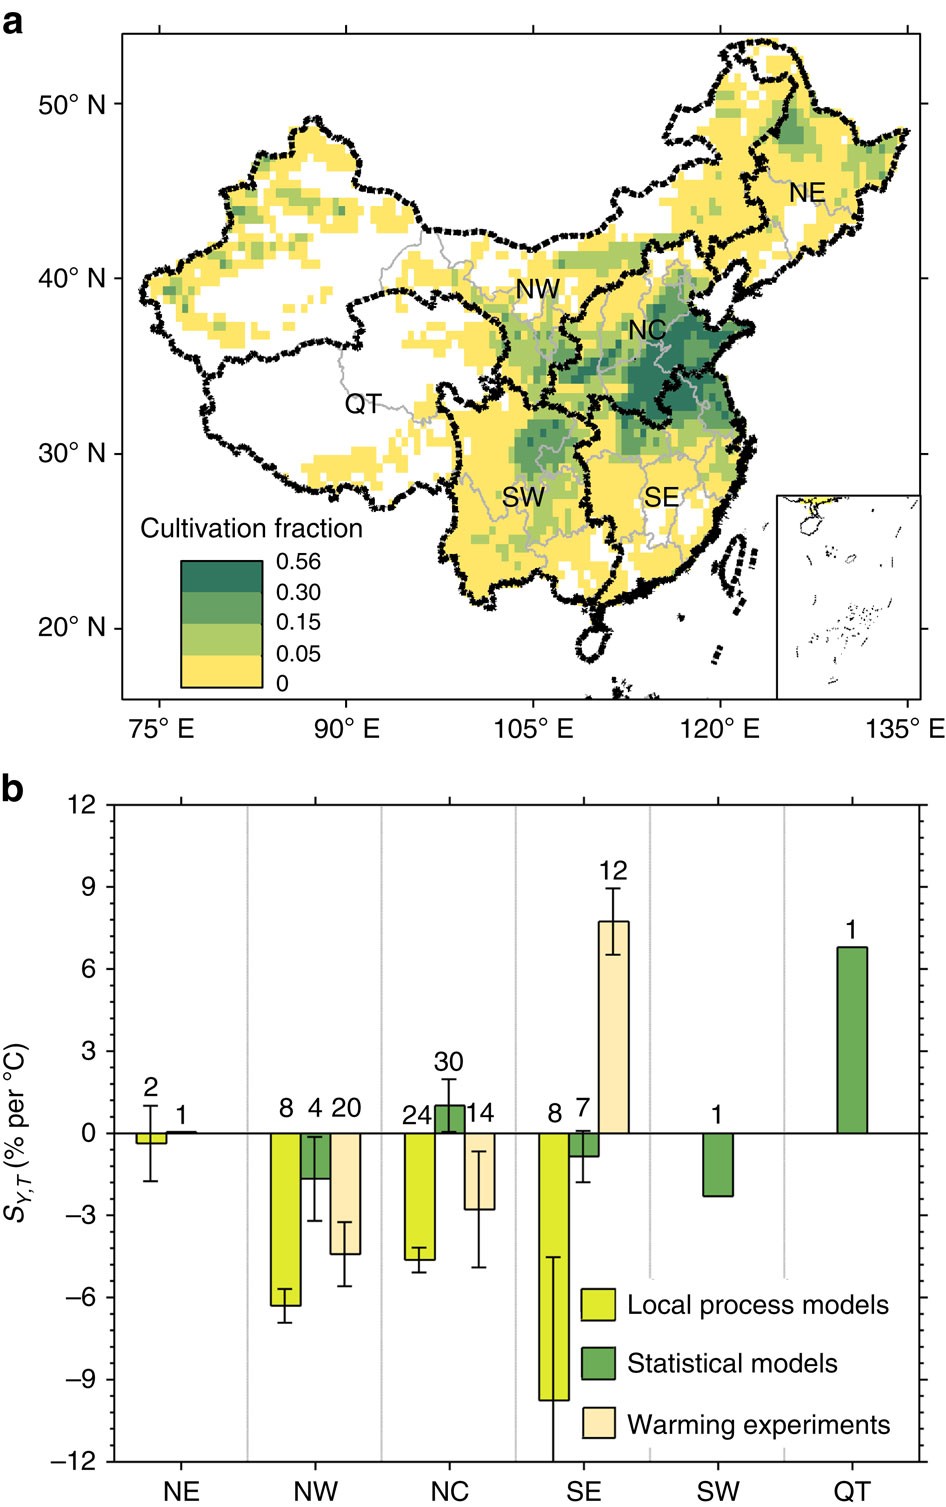
图 中国小麦种植分布比例和产量的空间模式
(a)中国六个生产区的小麦种植比例。NE、NW、NC、SE、SW、QT分别代表中国东北部、中国西北部、华北、华东南部、中国西南部和青藏地区。(b)不同方法的SY、T的区域差异(均值±标准误)。分析中使用的观测数量显示在每个柱状图的上方。地图是使用Matlab R2014b创建的。
原文链接:https://www.nature.com/articles/ncomms13530#Bib1